2.3. Machine Learning Introduction
Teaching computer how to do operations without explicitly hard-coding it.
With huge amounts of data we are dealing currently and ever increasing computation power the analysis requires a new approach
Machine Learning is a field of study that gives computers the ability to learn without being explicitly programmed.
—Arthur Samuel, 1959
2.3.1. What is Machine Learning?
Dzięki specjalnym algorytmom komputery będą w stanie z coraz większą dokładnością przewidywać rozwiązanie problemów. Bez względu na to czy mamy zamiar wykryć:
trend w danych marketingowych,
przewidzieć sprzedaż danego produktu,
przewidzieć wynik wyborów,
anomalię w logach płatności i danych kredytowych,
wykryć oszustwa (ang. fraud),
wykryć nietypowe odczyty urządzeń,
kategoryzować chorych wg. klas i stanu zdrowia.
Komputer zrobi to szybciej i dokładniej niż człowiek. Do każdego z wyżej wymienionych tematów możemy zastosować odpowiedni model, który podpowie nam odpowiedź.
Czym jest Machine Learning?
Czy temat rzeczywiście wymaga znajomości zaawansowanej matematyki?
Jak określić problem i tworzyć zbiór danych?
Jak wyselekcjonować dobre cechy?
Jak wybrać a później dostosować model?
Jak przedstawić go graficznie i zinterpretować wyniki?
Jak konstruować sieci neuronowe i jak wykorzystywać istniejące biblioteki?
O klasach algorytmów i ich trafnym doborze do odpowiedniego problemu, jak również ich przykładowej implementacji opowiemy w trakcie cyklu Machine Learning w Pythonie. Zapraszam do artykułu gdzie odpowiemy na powyższe zagadnienia!
2.3.2. Application
Self-driving cars
Robotics
Language Processing
Vision Processing
Forecasting Stock Market Trends
Forecasting Weather
2.3.3. Steps
How does this work in real world?
How much training data do you need?
How is the tree created?
What makes a good feature?
Import the Data
typically CSV file
could be from database
Clean the Data:
remove irrelevant data (because model can lean a bad patterns)
remove incomplete data (or fix them: fill with default, approximate, extrapolate)
remove duplicates
convert text data to numerical values (such as music kinds, movie generes, species)
Split the Data into Training/Test Sets
Teach model
Validate if model learned correctly
Create a Model
Search for an algorithm (such as sklearn)
Train a Model
Make Predictions
Evaluate and Improve
Either select other algorithm
Optimize or change parameters to algorithm
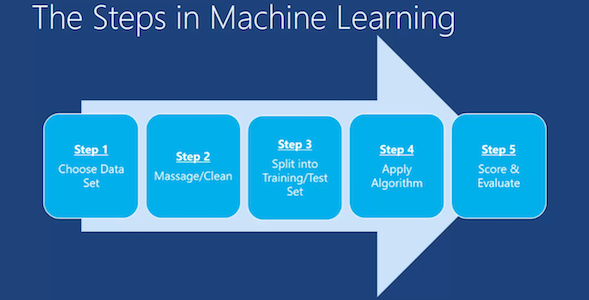
Figure 2.28. Machine Learning Steps
2.3.4. Datasets
More information in Machine Learning Datasets
2.3.5. Python Requirements
Machine Learning to bardzo duży i złożony temat, a tak naprawdę to osobna gałąź informatyki. Podczas tych artykułów chciałbym się skupić na praktycznym wykorzystaniu uczenia maszynowego do rozwiązywania problemów.
Either select other algorithm
Optimize or change parameters to algorithm
Python Syntax
Basic Types
Basic Sequences
Basic Mappings
Basic Control Flow
Basic Loops
Basic Files
Basic Functions
Basic OOP
Stdlib Mathematics
Stdlib Serialization
Stdlib Modules and Packages
2.3.6. Environment
Python 3.8+
Libs manually installed or via
requirements.txtnumpypandasscikit-learnmatplotlibjupyterorjupyterlab
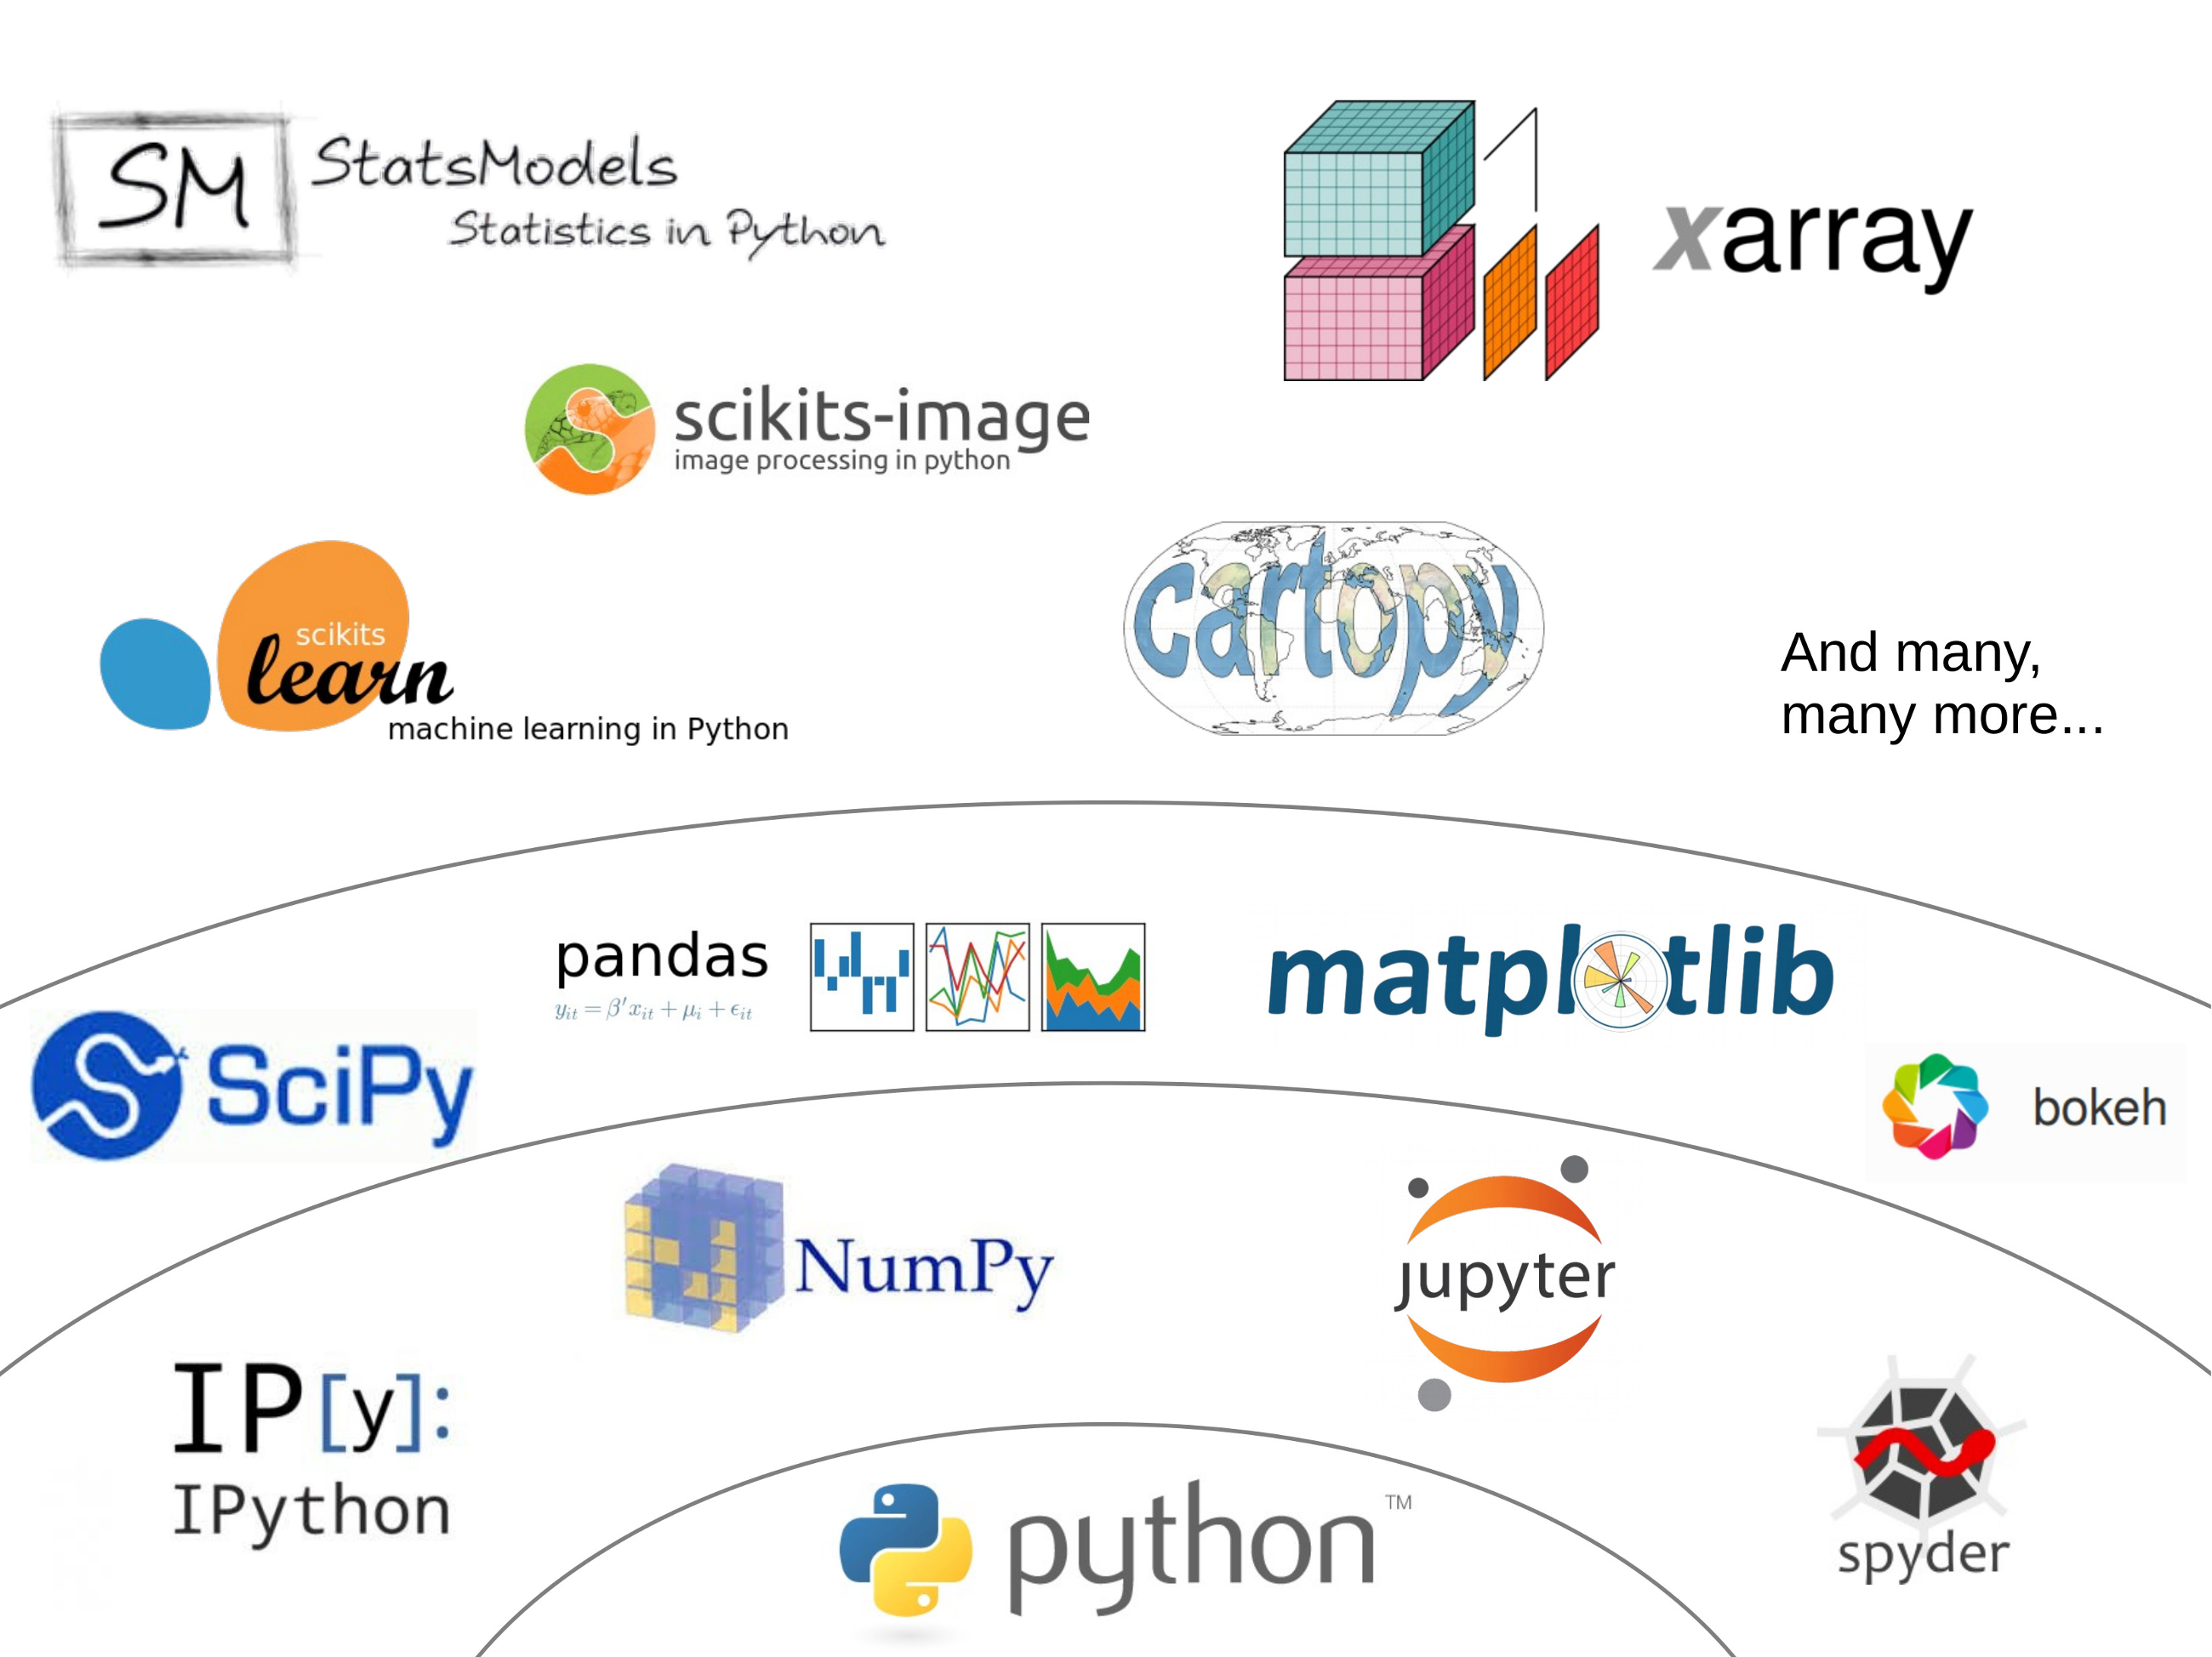
Figure 2.29. Scipy Ecosystem
2.3.7. Runtime
PyCharm
Jupyter Notebook
Jupyter Lab
JupyterThe Jupyter Notebook is an open-source web application that allows you to create and share documents that contain live code, equations, visualizations and explanatory text. Uses include: data cleaning and transformation, numerical simulation, statistical modeling, machine learning and much more.
Jupyter notebook is a language-agnostic HTML notebook application for Project Jupyter. In 2015, Jupyter notebook was released as a part of The Big Split™ of the IPython codebase. IPython 3 was the last major monolithic release containing both language-agnostic code, such as the IPython notebook, and language specific code, such as the IPython kernel for Python. As computing spans across many languages, Project Jupyter will continue to develop the language-agnostic Jupyter notebook in this repo and with the help of the community develop language specific kernels which are found in their own discrete repos.
2.3.8. Data Analysis
NumPyPandasSciPy
NumPyNumPy is the fundamental package for scientific computing with Python. It contains among other things:
a powerful N-dimensional array object
sophisticated (broadcasting) functions
tools for integrating C/C++ and Fortran code
useful linear algebra, Fourier transform, and random number capabilities
Besides its obvious scientific uses, NumPy can also be used as an efficient multi-dimensional container of generic data. Arbitrary data-types can be defined. This allows NumPy to seamlessly and speedily integrate with a wide variety of databases.
Pandaspandas is a Python package providing fast, flexible, and expressive data structures designed to make working with "relational" or "labeled" data both easy and intuitive. It aims to be the fundamental high-level building block for doing practical, real world data analysis in Python. Additionally, it has the broader goal of becoming the most powerful and flexible open source data analysis / manipulation tool available in any language. It is already well on its way toward this goal. Here are just a few of the things that pandas does well:
Easy handling of missing data (represented as NaN) in floating point as well as non-floating point data
Size mutability: columns can be inserted and deleted from DataFrame and higher dimensional objects
Automatic and explicit data alignment: objects can be explicitly aligned to a set of labels, or the user can simply ignore the labels and let Series, DataFrame, etc. automatically align the data for you in computations
Powerful, flexible group by functionality to perform split-apply-combine operations on data sets, for both aggregating and transforming data
Make it easy to convert ragged, differently-indexed data in other Python and NumPy data structures into DataFrame objects
Intelligent label-based slicing, fancy indexing, and subsetting of large data sets
Intuitive merging and joining data sets
Flexible reshaping and pivoting of data sets
Hierarchical labeling of axes (possible to have multiple labels per tick)
Robust IO tools for loading data from flat files (CSV and delimited), Excel files, databases, and saving/loading data from the ultrafast HDF5 format
Time series-specific functionality: date range generation and frequency conversion, moving window statistics, moving window linear regressions, date shifting and lagging, etc.
SciPySciPy (pronounced "Sigh Pie") is open-source software for mathematics, science, and engineering. It includes modules for statistics, optimization, integration, linear algebra, Fourier transforms, signal and image processing, ODE solvers, and more. It is also the name of a very popular conference on scientific programming with Python.
The SciPy library depends on NumPy, which provides convenient and fast N-dimensional array manipulation. The SciPy library is built to work with NumPy arrays, and provides many user-friendly and efficient numerical routines such as routines for numerical integration and optimization. Together, they run on all popular operating systems, are quick to install, and are free of charge. NumPy and SciPy are easy to use, but powerful enough to be depended upon by some of the world's leading scientists and engineers. If you need to manipulate numbers on a computer and display or publish the results.
SciPy builds on the NumPy array object and is part of the NumPy stack which includes tools like Matplotlib, pandas and SymPy, and an expanding set of scientific computing libraries. This NumPy stack has similar users to other applications such as MATLAB, GNU Octave, and Scilab. The NumPy stack is also sometimes referred to as the SciPy stack.
2.3.9. Data Visualization
MatplotlibBokehSeaborn
MatplotlibMatplotlib is a Python 2D plotting library which produces publication-quality figures in a variety of hardcopy formats and interactive environments across platforms. Matplotlib can be used in Python scripts, the Python and IPython shell (à la MATLAB or Mathematica), web application servers, and various graphical user interface toolkits.
It provides an object-oriented API for embedding plots into applications using general-purpose GUI toolkits like Tkinter, wxPython, Qt, or GTK+. There is also a procedural "pylab" interface based on a state machine (like OpenGL), designed to closely resemble that of MATLAB, though its use is discouraged. SciPy makes use of matplotlib.
2.3.10. Machine Learning
Scikit-learnPyMC3
Scikit-learnA set of python modules for machine learning and data mining. It features various classification, regression and clustering algorithms including support vector machines, random forests, gradient boosting, k-means and DBSCAN, and is designed to interoperate with the Python numerical and scientific libraries NumPy and SciPy.
Simple and efficient tools for data mining and data analysis
Accessible to everybody, and reusable in various contexts
Built on NumPy, SciPy, and matplotlib
Open source, commercially usable - BSD license
PyMC3PyMC3 is a Python package for Bayesian statistical modeling and Probabilistic Machine Learning which focuses on advanced Markov chain Monte Carlo and variational fitting algorithms. Its flexibility and extensibility make it applicable to a large suite of problems.
2.3.11. Neural Networks
KerasTensorFlowPyTorch
TensorFlowTensorFlow is an open source software library for numerical computation using data flow graphs. Nodes in the graph represent mathematical operations, while the graph edges represent the multidimensional data arrays (tensors) that flow between them. This flexible architecture lets you deploy computation to one or more CPUs or GPUs in a desktop, server, or mobile device without rewriting code. TensorFlow also includes TensorBoard, a data visualization toolkit.
TensorFlow was originally developed by researchers and engineers working on the Google Brain team within Google's Machine Intelligence Research organization for the purposes of conducting machine learning and deep neural networks research. The system is general enough to be applicable in a wide variety of other domains, as well.
2.3.12. Cleaning Data
80% of machine learning and data science is cleaning data
Is This the Same Address?
This is a dump of distinct records of a single address
Which one of the below is a true address?
Numbers:
>>> number = 1
>>> number = 1.0
>>> number = 1.00
>>>
>>> number = '1'
>>> number = '1.0'
>>> number = '1.00'
Addresses:
>>> street = 'ul. Jana III Sobieskiego'
>>> street = 'ul Jana III Sobieskiego'
>>> street = 'ul.Jana III Sobieskiego'
>>> street = 'ulicaJana III Sobieskiego'
>>> street = 'Ul. Jana III Sobieskiego'
>>> street = 'UL. Jana III Sobieskiego'
>>> street = 'ulica Jana III Sobieskiego'
>>> street = 'Ulica. Jana III Sobieskiego'
>>>
>>> street = 'os. Jana III Sobieskiego'
>>>
>>> street = 'Jana 3 Sobieskiego'
>>> street = 'Jana 3ego Sobieskiego'
>>> street = 'Jana III Sobieskiego'
>>> street = 'Jana Iii Sobieskiego'
>>> street = 'Jana IIi Sobieskiego'
>>> street = 'Jana lll Sobieskiego'  # three small letters 'L'
Address prefix (street, road, court, place, etc.):
>>> prefix = 'ul'
>>> prefix = 'ul.'
>>> prefix = 'Ul.'
>>> prefix = 'UL.'
>>> prefix = 'ulica'
>>> prefix = 'Ulica'
>>>
>>> prefix = 'os'
>>> prefix = 'os.'
>>> prefix = 'Os.'
>>> prefix = 'osiedle'
>>> prefix = 'oś'
>>> prefix = 'oś.'
>>> prefix = 'Oś.'
>>> prefix = 'ośedle'
>>>
>>> prefix = 'pl'
>>> prefix = 'pl.'
>>> prefix = 'Pl.'
>>> prefix = 'plac'
>>>
>>> prefix = 'al'
>>> prefix = 'al.'
>>> prefix = 'Al.'
>>> prefix = 'aleja'
>>> prefix = 'aleia'
>>> prefix = 'alei'
>>> prefix = 'aleii'
>>> prefix = 'aleji'
House and apartment number:
>>> address = 'Ćwiartki 3/4'
>>> address = 'Ćwiartki 3 / 4'
>>> address = 'Ćwiartki 3 m. 4'
>>> address = 'Ćwiartki 3 m 4'
>>> address = 'Brighton Beach 1st apt 2'
>>> address = 'Brighton Beach 1st apt. 2'
>>> address = 'Myśliwiecka 3/5/7'
>>>
>>> address = 'Pana Twardowskiego 180f/8f'
>>> address = 'Pana Twardowskiego 180f/8'
>>> address = 'Pana Twardowskiego 180/8f'
>>>
>>> address = 'Pana Twardowskiego III 3 m. 3'
>>> address = 'Pana Twardowskiego 13d bud. A piętro II sala 3'
Phone Numbers:
>>> phone = '123 555 1337'
>>> phone = '1235551337'
>>> phone = '+11235551337'
>>> phone = '+1 12 3555 1337'
>>> phone = '+1 123 555 1337'
>>> phone = '+1 (123) 555 1337'
>>> phone = '+1 (123) 555-1337'
>>> phone = '+1 (123)-555-1337'
>>> phone = '+1 (123).555.1337'
>>>
>>> phone = '+1 800-python'
>>> phone = '+1 800-798466'
>>>
>>> phone = '+48 123555133,1'
>>> phone = '+48 123555133,1,,2'
>>> phone = '+48 123 555 133 wew. 7'
Dates:
>>> date = '1961-04-12'
>>> date = '12.4.1961'
>>> date = '12.04.1961'
>>> date = '12-04-1961'
>>> date = '12/04/1961'
>>> date = '4/12/61'
>>> date = '4.12.1961'
>>> date = 'Apr 12, 1961'
>>> date = 'Apr 12th, 1961'
2.3.13. Working with scikit-learn
Import the class you plan to use
Instantiate the estimator
Estimator is the
scikit-learnword for modelInstantiate means create an object from the class
Name of the object does not matter
Can specify the tuning parameters also known as "hyperparameters" during this step
All parameters not specified are set to their defaults
Fit the model with data (aka "model training")
Models is learning the relationship between \(X\) and \(Y\) (features and labels)
Occurs in-place (aka change object state - mutate object)
Predict the response for a new observation
New observations are called "out-of-sample" data
Uses the information it learned during the model training process
Returns a
NumPyarrayCan predict for multiple observations at once
# Import the class you plan to use
from sklearn.neighbours import KNeighboursClassifier


features = ...  # Pandas DataFrame or Python list[list|tuple]
labels = ... # Pandas DataFrame or Python list[int|str|float]

# Instantiate the estimator
model = KNeighboursClassifier(n_neighbours=1)

# Fit the model with data (aka "model training")
model.fit(features, labels)

# Predict the response for a new observation
model.predict([3, 5, 4, 2])
# array([2])

# Can predict for multiple observations at once
model.predict([
    [3, 5, 4, 2],
    [5, 4, 3, 2],
])
# array([2, 1])
from sklearn.neighbours import KNeighboursClassifier


features = ...  # Pandas DataFrame or Python list[list|tuple]
labels = ... # Pandas DataFrame or Python list[int|str|float]

model = KNeighboursClassifier(n_neighbours=5)
model.fit(features, labels)

model.predict([
    [3, 5, 4, 2],
    [5, 4, 3, 2],
])
# array([1, 1])
from sklearn.linear_model import LogisticsRegression

model = LogisticsRegression()
model.fit(features, labels)

model.predict([
    [3, 5, 4, 2],
    [5, 4, 3, 2],
])
# array([2, 0])
Training models can take a while for small datasets, but several hours or days for huge data. In order to avoid learning model each time when we run script, you can persist trained model to a file:
from sklearn.linear_model import LogisticsRegression
from sklearn.externals import joblib


features = ...  # Pandas DataFrame or Python list[list|tuple]
labels = ... # Pandas DataFrame or Python list[int|str|float]

model = LogisticsRegression()
model.fit(features, labels)

joblib.dump(model, 'myfile.joblib')
Then it is very easy to restore trained model and use it to predict:
from sklearn.linear_model import LogisticsRegression
from sklearn.externals import joblib

model = joblib.load('myfile.joblib')

model.predict([
    [3, 5, 4, 2],
    [5, 4, 3, 2],
])
# array([2, 0])
2.3.14. Machine Learning Algorithms Categories
2.3.15. Supervised Learning
Input data is called training data and has a known label or result such as spam/not-spam or a stock price at a time.
A model is prepared through a training process in which it is required to make predictions and is corrected when those predictions are wrong.
The training process continues until the model achieves a desired level of accuracy on the training data.
Example problems are classification and regression.
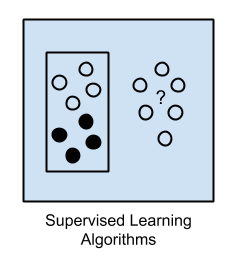
Figure 2.30. Supervised Learning - Z nadzorem
Drzewa decyzyjne
K najbliższych sąsiadów (ang. K Nearest Neighbors)
Regresja liniowa (ang. Linear Regression)
Regresja logistyczna
Support Vector Machines (SVM)
Naive Bayes
Sztuczne sieci neuronowe (ang. neural networks)
2.3.16. Unsupervised Learning
Input data is not labeled and does not have a known result.
A model is prepared by deducing structures present in the input data.
This may be to extract general rules. It may be through a mathematical process to systematically reduce redundancy, or it may be to organize data by similarity.
- Example problems are clustering, dimensionality reduction and association
rule learning:
Klastrowanie (ang. flat clustering, hierarchical clustering)
Principal Component Analysis (PCA)
Sztuczne sieci neuronowe (ang. neural networks)
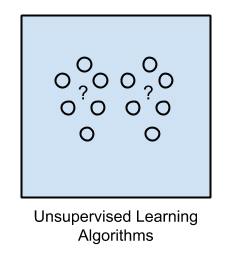
Figure 2.31. Unsupervised Learning - Bez nadzoru
2.3.17. Semi-Supervised Learning
Input data is a mixture of labeled and unlabelled examples.
There is a desired prediction problem but the model must learn the structures to organize the data as well as make predictions.
Example problems are classification and regression.
Example algorithms are extensions to other flexible methods that make assumptions about how to model the unlabeled data.
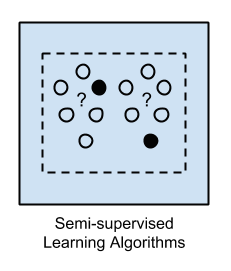
Figure 2.32. Semi-Supervised Learning
połączenie obu światów
nie wszystkie dane mają labele
przyszłość machine learning
ze względu na wolumen danych, nie wszystkie mogą labele
man (human) in the loop:
ekspert labeluje część danych
komputer dokonuje wstępnej analizy części danych
przedstawia iterację człowiekowi
człowiek interaktywnie poprawia i określa jakość oznaczania
komputer dokonuje kolejnej analizy
2.3.18. Reinforcement Learning
Reinforcement learning (RL) is an area of machine learning concerned with how intelligent agents ought to take actions in an environment in order to maximize the notion of cumulative reward [2].
Reinforcement learning is one of three basic machine learning paradigms, alongside supervised learning and unsupervised learning.
Reinforcement learning differs from supervised learning in not needing labelled input/output pairs be presented, and in not needing sub-optimal actions to be explicitly corrected. Instead the focus is on finding a balance between exploration (of uncharted territory) and exploitation (of current knowledge) [3].
The environment is typically stated in the form of a Markov decision process (MDP), because many reinforcement learning algorithms for this context use dynamic programming techniques [4]. The main difference between the classical dynamic programming methods and reinforcement learning algorithms is that the latter do not assume knowledge of an exact mathematical model of the MDP and they target large MDPs where exact methods become infeasible.
Source: [1]