5.1. Decision Tree
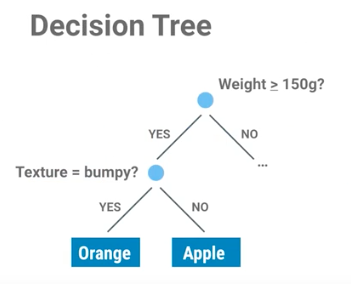
Figure 5.46. Drzewo decyzyjne
from sklearn import tree

# Input to the classifier
# as of Scikit-learn uses real-valued features, we use:
# 0: bumpy
# 1: smooth
#
# features = [
#    [140, 'smooth'],
#    [130, 'smooth'],
#    [150, 'bumpy'],
#    [170, 'bumpy'],
# ]

features = [
    [140, 1],
    [130, 1],
    [150, 0],
    [170, 0],
]

# Output that we want from classifier
# as of Scikit-learn uses real-valued features, we use:
# 0: apple
# 1: orange
#
# labels = ['apple', 'apple', 'orange', 'orange']
labels = [0, 0, 1, 1]


# create decision tree
clf = tree.DecisionTreeClassifier()

# fit - synonim to "find patterns in data"
clf = clf.fit(features, labels)

# use classifier to predict
result = clf.predict([[160, 0]])

print(result)
# should be: [1]
from sklearn import datasets
from sklearn import tree
from sklearn.metrics import accuracy_score
from sklearn.model_selection import train_test_split
from sklearn.neighbors import KNeighborsClassifier

iris = datasets.load_iris()

# Features
x = iris.data

# Labels
y = iris.target

# Split dataset into test and training set in half
x_train, x_test, y_train, y_test = train_test_split(x, y, test_size=0.5)

# Create classifier
decision_tree = tree.DecisionTreeClassifier()

# Train classifier using training data
decision_tree.fit(x_train, y_train)

# Predict
predictions = decision_tree.predict(x_test)

# How accurate was classifier on testing set
# Because of some variation for each run, it might give different results
result = accuracy_score(y_test, predictions)
print(result)
# Output: 0.96
Note identical API for classifiers!
5.1.1. Visualizing a Decision Tree
import numpy
from sklearn.datasets import load_iris
from sklearn import tree

iris = load_iris()

# select test indexes
# dataset is ordered so 0, 50, 100 is a first of each kind
test_idx = [0, 50, 100]


# training data
train_target = numpy.delete(iris.target, test_idx)
train_data = numpy.delete(iris.data, test_idx, axis=0)

# testing data
test_target = iris.target[test_idx]
test_data = iris.data[test_idx]

# create and train classifier
clf = tree.DecisionTreeClassifier()
clf.fit(train_data, train_target)


print(test_target)
# [0 1 2]

result = clf.predict(test_data)
print(result)
# [0 1 2]


print(test_data[0], test_target[0])
# [ 5.1  3.5  1.4  0.2] 0


print(iris.feature_names)
# ['sepal_length (cm)', 'sepal_width (cm)', 'petal_length (cm)', 'petal_width (cm)']

print(iris.target_names)
# ['setosa' 'versicolor' 'virginica']


# Visualization of Decision Tree Classifier
from sklearn.externals.six import StringIO
import pydotplus

dot_data = StringIO()
tree.export_graphviz(
    decision_tree=clf,
    out_file=dot_data,
    feature_names=iris.feature_names,
    class_names=iris.target_names,
    filled=True,
    rounded=True,
    impurity=True
)

graph = pydotplus.graph_from_dot_data(dot_data.getvalue())
graph.write_pdf('/tmp/iris.pdf')
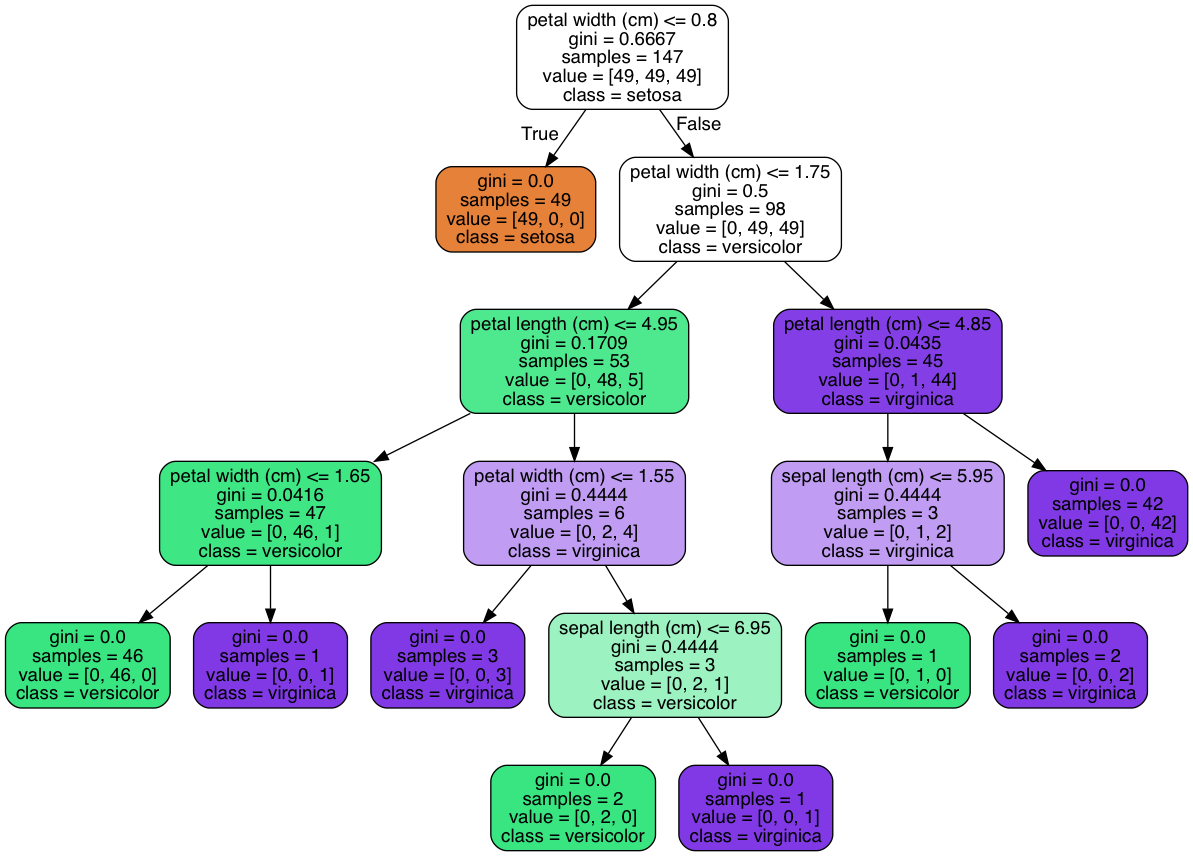
Figure 5.47. Visualization of Decision Tree Classifier
5.1.2. Zadania praktyczne
5.1.3. Prosta klasyfikacja na podstawie features i labels
Stwórz Classifier dla podanych poniżej danych testowych:
Gender |
Height |
Weight |
Foot Size |
|---|---|---|---|
male |
6.00 |
180 |
12 |
male |
5.92 |
190 |
11 |
male |
5.58 |
170 |
12 |
male |
5.92 |
165 |
10 |
female |
5.00 |
100 |
6 |
female |
5.50 |
150 |
8 |
female |
5.42 |
130 |
7 |
female |
5.75 |
150 |
9 |
Jaką płeć ma osoba o parametrach?:
Height: 6
Weight: 130
Foot Size: 8
Zwizualizuj drzewo decyzyjne
- Hints:
preprocessing.LabelEncoder()
5.1.4. Banknoty
Na podstawie dataset 1372 banknotów z 5 wartościami numerycznymi pobranymi z obrazu odpowiedz czy dany banknot jest prawdziwy wykorzystując algorytm drzewa decyzyjnego.
variance of Wavelet Transformed image (continuous).
skewness of Wavelet Transformed image (continuous).
kurtosis of Wavelet Transformed image (continuous).
entropy of image (continuous).
class (integer).