3.7. Advanced Styling
3.7.1. Label rotation
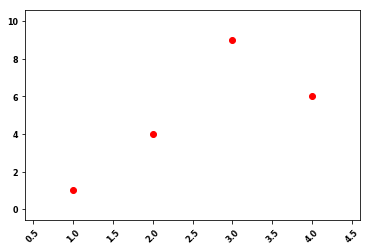
Figure 3.17. Label rotation
3.7.2. Grid
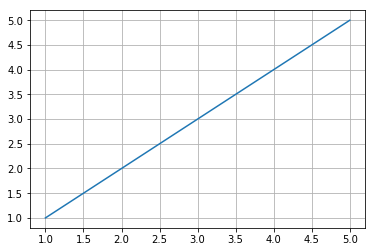
Figure 3.18. Grid Simple
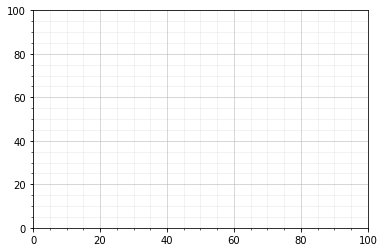
Figure 3.19. Grid Extra
3.7.3. Trend line
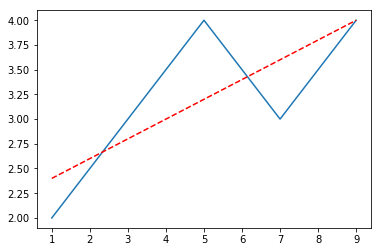
Figure 3.20. Trend line
3.7.4. Error bars
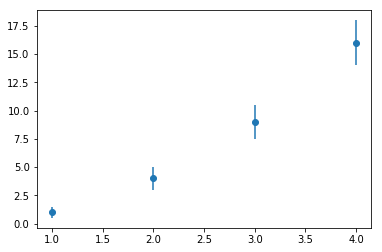
Figure 3.21. Error bars
3.7.5. Colorbar
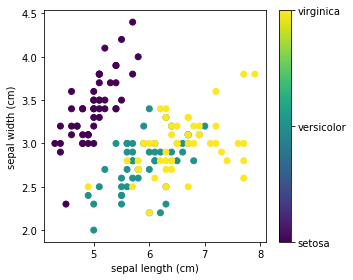
Figure 3.22. Colorbar
3.7.6. Changing colors
ax.spines['bottom'].set_color('#dddddd')
ax.spines['top'].set_color('#dddddd')
ax.spines['right'].set_color('red')
ax.spines['left'].set_color('red')
ax.tick_params(axis='x', colors='red')
ax.tick_params(axis='y', colors='red')
ax.yaxis.label.set_color('red')
ax.xaxis.label.set_color('red')
ax.title.set_color('red')
3.7.7. Using mathematical expressions in text
plt.title(r'$\sigma_i=15$')
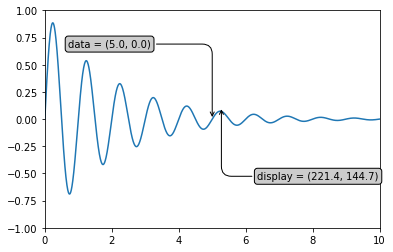
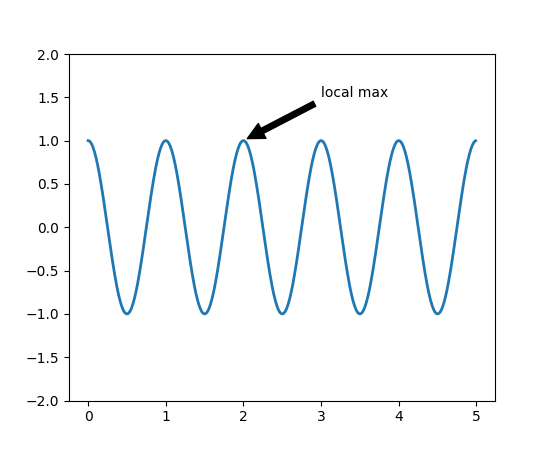
3.7.8. Annotations
3.7.9. Single Annotation
import matplotlib.pyplot as plt
import numpy as np

ax = plt.subplot(111)

t = np.arange(0.0, 5.0, 0.01)
s = np.cos(2*np.pi*t)
line, = plt.plot(t, s, lw=2)

plt.annotate('local max',
    xy=(2, 1),
    xytext=(3, 1.5),
    arrowprops={'facecolor': 'black', 'shrink': 0.05},
)

plt.ylim(-2,2)
plt.show()  # doctest: +SKIP
3.7.10. Multiple Annotations