1.4. About Workflow
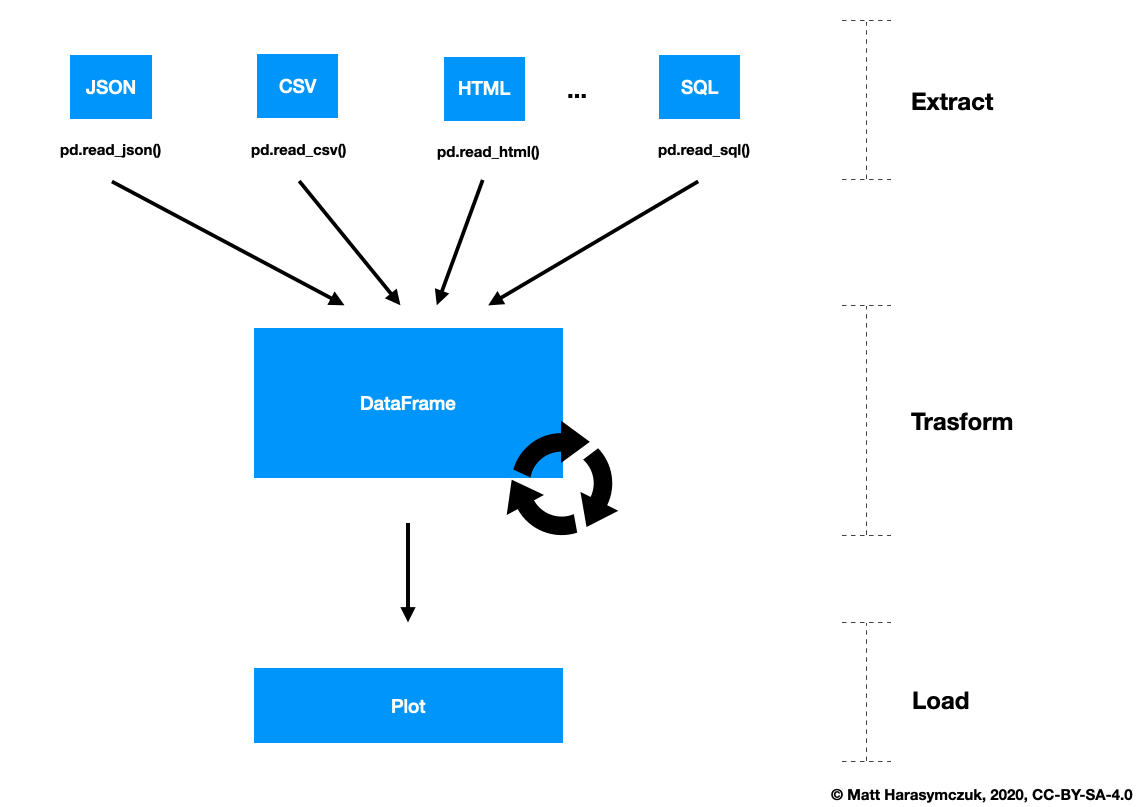
1.4.1. SetUp
>>> import pandas as pd
>>> import numpy as np
1.4.2. Working with Excel file
>>>
... df = pd.read_excel(
...     io='filename.xls',
...     sheet_name=['Sheet 1'],
...     skiprows=1,
...     skip_blank_lines=True,
...     parse_dates=['from', 'to'],
... )
...
... # Rename Columns to match database columns
... df.rename(columns={
...     'from': 'date_start',
...     'to': 'date_end',
... }, inplace=True)
...
... # Drop all records where "Name" is empty (NaN)
... df.dropna(subset=['name'], how='all', inplace=True)
...
... # Add column ``blacklist`` with data
... df['blacklist'] = [True, False, True, False]
...
... # Change NaN to 0
... df.fillna(0, inplace=True)
...
... # Select columns
... columns = ['name', 'date_start', 'date_end', 'blacklist']
...
... # Print results
... print( df[columns] )
1.4.3. Working with dirty CSV
>>> DATA = 'https://python3.info/_static/iris-dirty.csv'
>>> COLUMNS = ['sepal_length', 'sepal_width',
...            'petal_length', 'petal_width', 'species']
>>>
>>> nrows, ncols, *class_labels = pd.read_csv(DATA, nrows=0).columns
>>> label_encoder = dict(enumerate(class_labels))
>>>
>>> df = pd.read_csv(DATA, skiprows=1, names=COLUMNS)
>>> df['species'].replace(label_encoder, inplace=True)
>>> plot = df.plot(kind='density')
1.4.4. Working with CSV
>>> DATA = 'https://python3.info/_static/iris-clean.csv'
Read data from source:
>>> df = pd.read_csv(DATA)
Rename columns:
>>> df.columns = ['sepal_length', 'sepal_width',
...               'petal_length', 'petal_width', 'species']
Get first n records:
>>> df.head(n=5)
   sepal_length  sepal_width  petal_length  petal_width     species
0           5.4          3.9           1.3          0.4      setosa
1           5.9          3.0           5.1          1.8   virginica
2           6.0          3.4           4.5          1.6  versicolor
3           7.3          2.9           6.3          1.8   virginica
4           5.6          2.5           3.9          1.1  versicolor
Get last n records:
>>> df.tail(n=3)
     sepal_length  sepal_width  petal_length  petal_width    species
148           4.9          2.5           4.5          1.7  virginica
149           6.3          2.8           5.1          1.5  virginica
150           6.8          3.2           5.9          2.3  virginica
Shuffle columns and reset indexes (drop column with old index):
>>> np.random.seed(0)
>>> df.sample(n=10).reset_index(drop=True)
   sepal_length  sepal_width  petal_length  petal_width     species
0           6.7          3.3           5.7          2.1   virginica
1           6.5          2.8           4.6          1.5  versicolor
2           6.3          2.3           4.4          1.3  versicolor
3           6.8          2.8           4.8          1.4  versicolor
4           5.7          2.9           4.2          1.3  versicolor
5           6.3          3.4           5.6          2.4   virginica
6           5.5          2.4           3.8          1.1  versicolor
7           6.9          3.1           5.4          2.1   virginica
8           6.3          2.5           4.9          1.5  versicolor
9           4.9          3.1           1.5          0.2      setosa
Calculate descriptive statistics:
>>> df.describe()
       sepal_length  sepal_width  petal_length  petal_width
count    151.000000   151.000000    151.000000   151.000000
mean       5.840397     3.062914      3.741722     1.194040
std        0.826089     0.439790      1.770738     0.762472
min        4.300000     2.000000      1.000000     0.100000
25%        5.100000     2.800000      1.550000     0.300000
50%        5.800000     3.000000      4.300000     1.300000
75%        6.400000     3.350000      5.100000     1.800000
max        7.900000     4.400000      6.900000     2.500000
Function |
Description |
|---|---|
|
Number of non-null observations |
|
Sum of values |
|
Mean of values |
|
Mean absolute deviation |
|
Arithmetic median of values |
|
Minimum |
|
Maximum |
|
Mode |
|
Absolute Value |
|
Product of values |
|
Unbiased standard deviation |
|
Unbiased variance |
|
Unbiased standard error of the mean |
|
Unbiased skewness (3rd moment) |
|
Unbiased kurtosis (4th moment) |
|
Sample quantile (value at %) |
|
Cumulative sum |
|
Cumulative product |
|
Cumulative maximum |
|
Cumulative minimum |
1.4.5. Hist Plot
>>> import matplotlib.pyplot as plt
>>> import pandas as pd
>>>
>>>
>>> DATA = 'https://python3.info/_static/iris-clean.csv'
>>>
>>> df = pd.read_csv(DATA)
>>> plot = df.hist()
>>> plt.show()
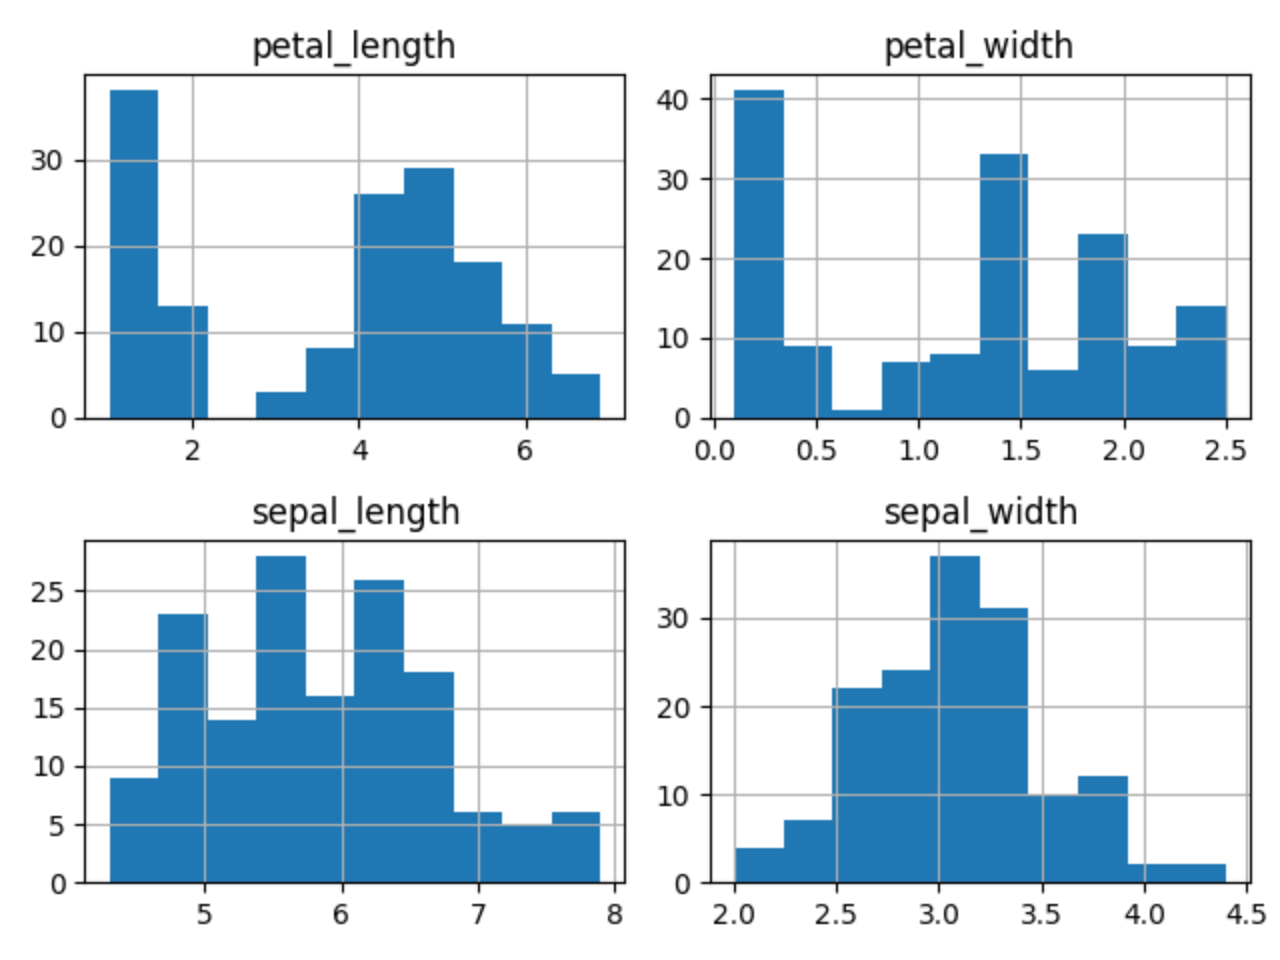
Figure 1.8. Visualization using hist
1.4.6. Density Plot
>>> import matplotlib.pyplot as plt
>>> import pandas as pd
>>>
>>>
>>> DATA = 'https://python3.info/_static/iris-clean.csv'
>>>
>>> df = pd.read_csv(DATA)
>>> plot = df.plot(kind='density', subplots=True, layout=(2,2), sharex=False)
>>> plt.show()
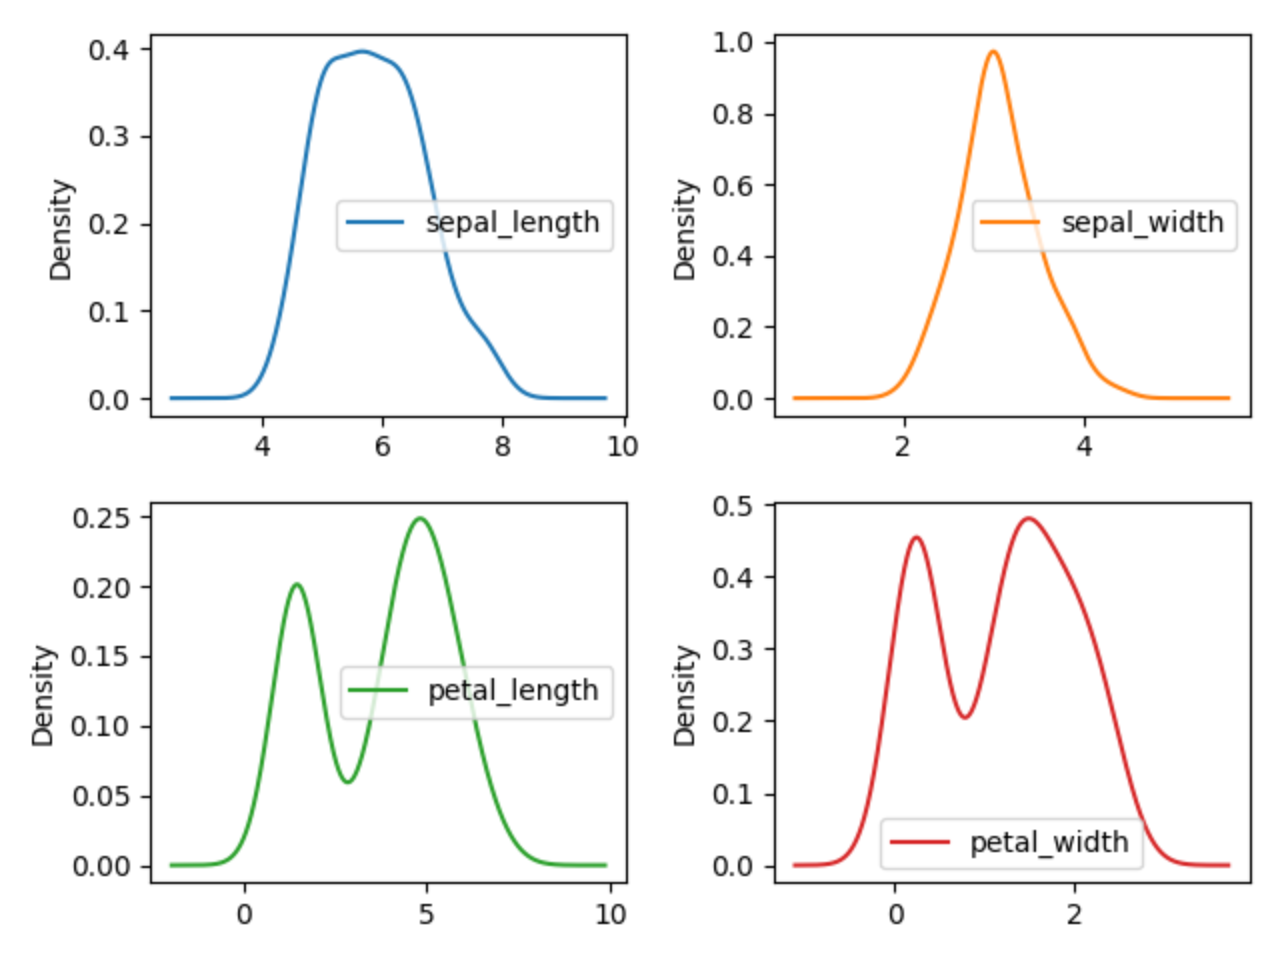
Figure 1.9. Visualization using density
1.4.7. Box Plot
>>> import matplotlib.pyplot as plt
>>> import pandas as pd
>>>
>>>
>>> DATA = 'https://python3.info/_static/iris-clean.csv'
>>>
>>> df = pd.read_csv(DATA)
>>> plot = df.plot(kind='box', subplots=True, layout=(2,2), sharex=False, sharey=False)
>>> plt.show()
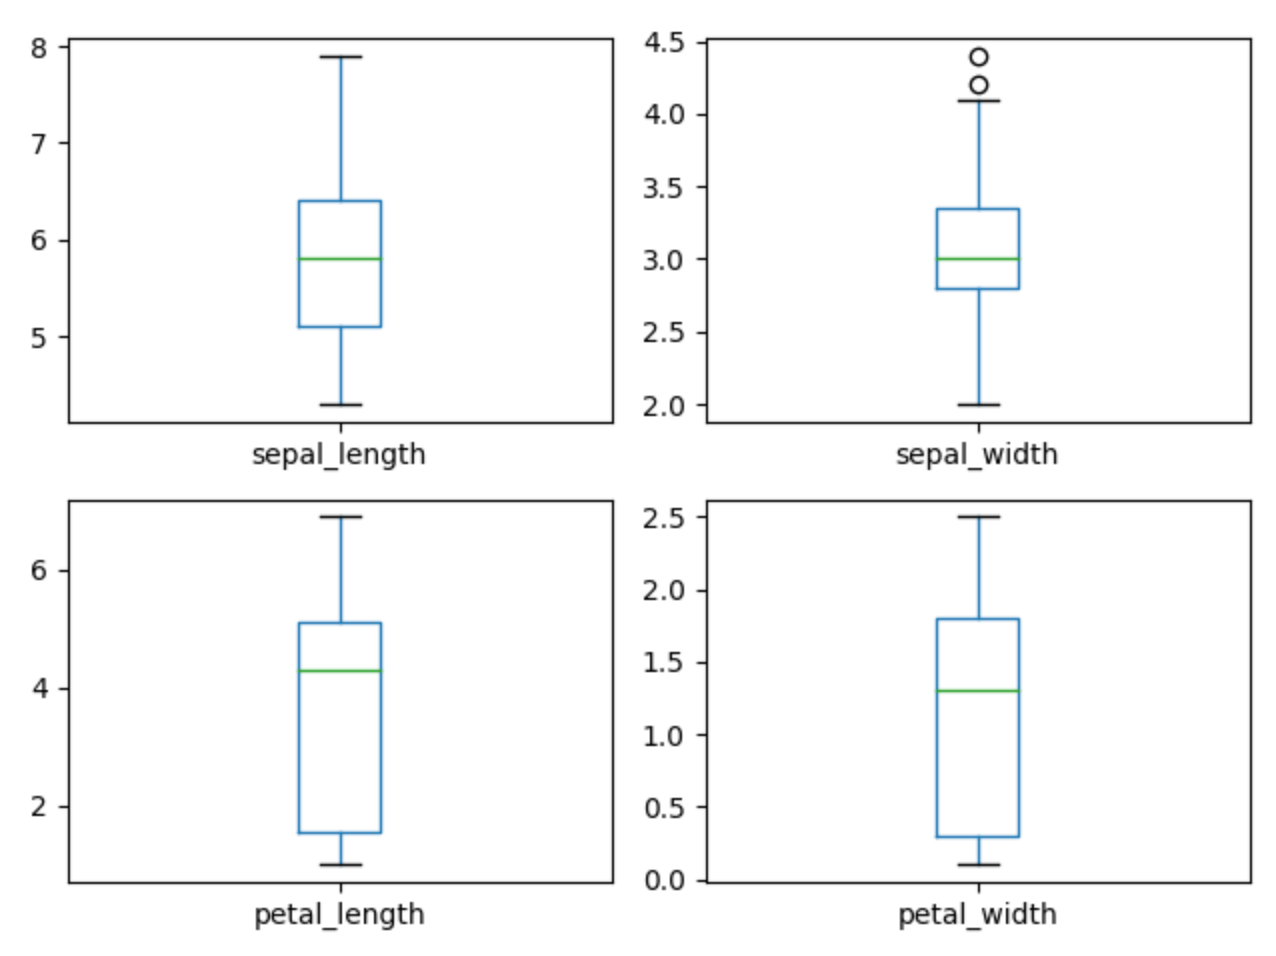
Figure 1.10. Visualization using density
1.4.8. Scatter matrix
>>> import matplotlib.pyplot as plt
>>> import pandas as pd
>>> from pandas.plotting import scatter_matrix
>>>
>>>
>>> DATA = 'https://python3.info/_static/iris-clean.csv'
>>>
>>> df = pd.read_csv(DATA)
>>> plot = scatter_matrix(df)
>>> plt.show()
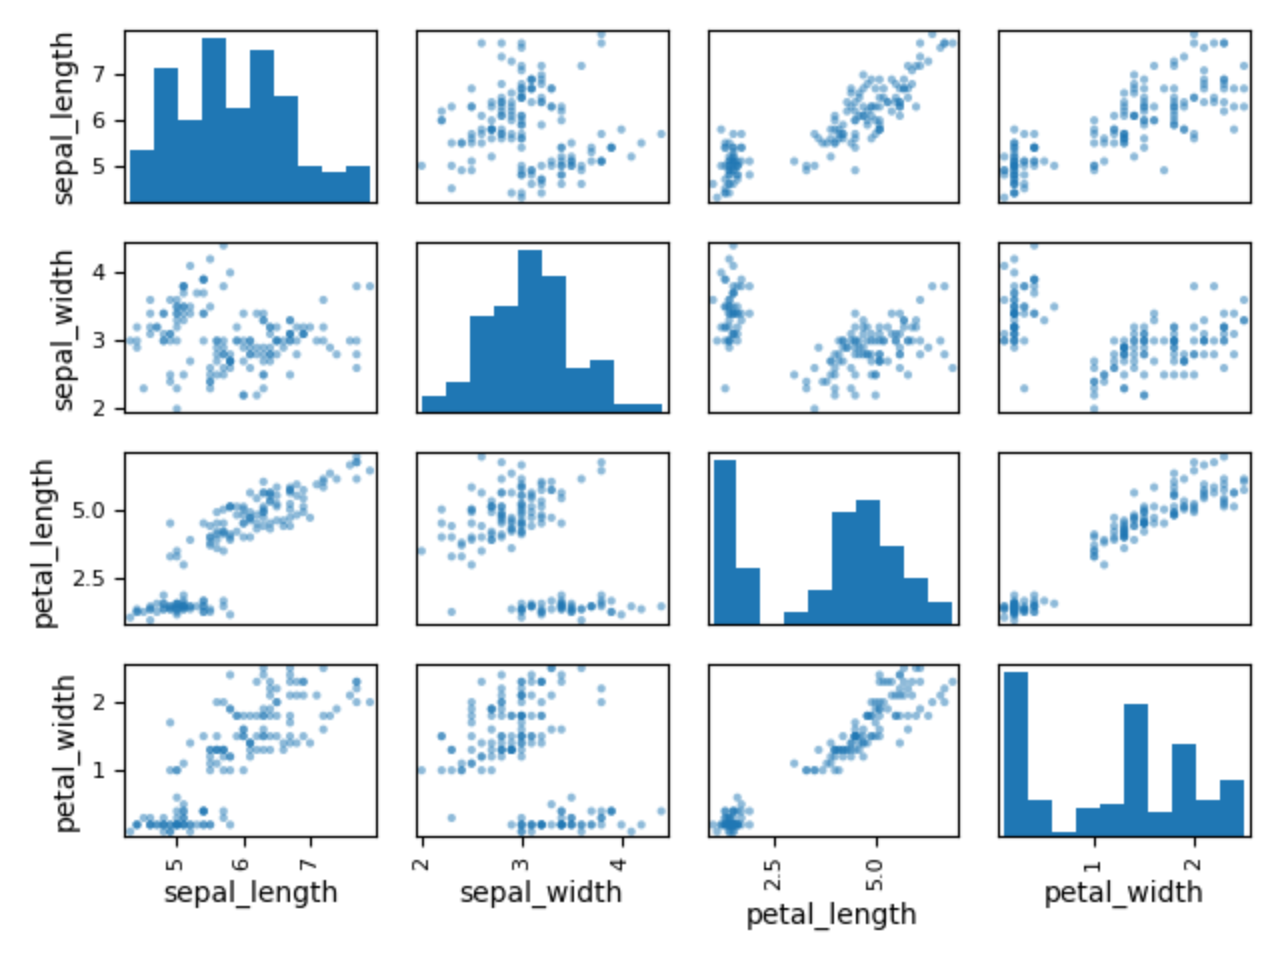
Figure 1.11. Visualization using density