5.1. Matplotlib Examples
5.1.1. Examples
import matplotlib.pyplot as plt
import numpy as np


# evenly sampled time at 200ms intervals
t = np.arange(0., 5., 0.2)

# red dashes, blue squares and green triangles
plt.plot(t, t, 'r--', t, t**2, 'bs', t, t**3, 'g^')
plt.show()  # doctest: +SKIP
import matplotlib.pyplot as plt
import numpy as np


# evenly sampled time at 200ms intervals
t = np.arange(0., 5., 0.2)

# red dashes, blue squares and green triangles
plt.plot(t, t, 'r--')
plt.plot(t, t**2, 'bs')
plt.plot(t, t**3, 'g^')

plt.show()  # doctest: +SKIP
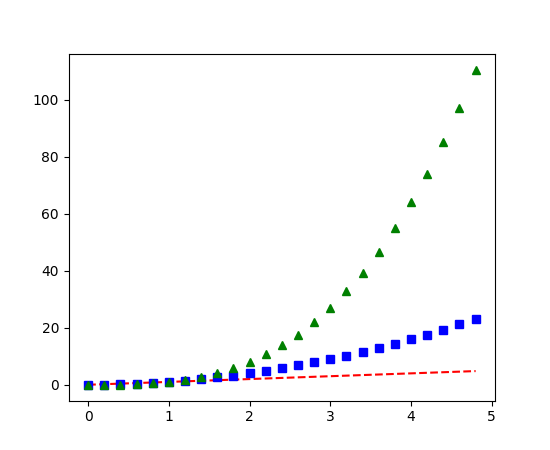
Figure 5.42. Multiple lines on one chart
5.1.2. Gallery
5.1.3. Scales
5.1.4. Grid
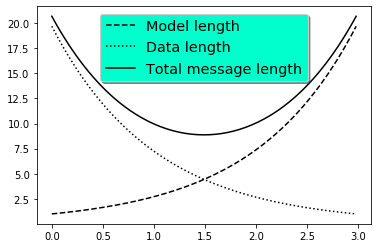
5.1.5. Legend using pre-defined labels
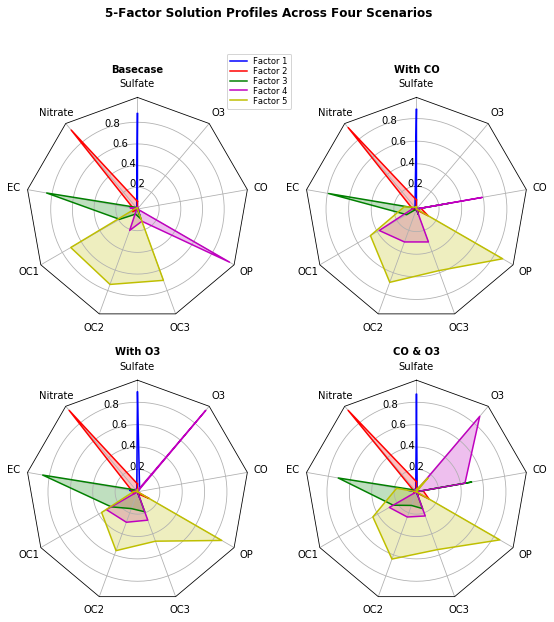
5.1.6. Radar Chart