5.22. DataFrame Plotting
5.22.1. Plot kinds
line- Line Plotbar- Vertical Bar Plotbarh- Horizontal Bar Plothist- Histogrambox- Boxplotdensity,kde- Kernel Density Estimation Plotarea- Area Plotpie- Pie Plotscatter- Scatter Plothexbin- Hexbin Plot
5.22.2. Parameters
Parameter |
Default value |
|---|---|
x |
|
y |
|
kind |
line |
ax |
|
subplots |
|
sharex |
|
sharey |
|
layout |
|
figsize |
|
use_index |
|
title |
|
grid |
|
legend |
|
style |
|
logx |
|
logy |
|
loglog |
|
xticks |
|
yticks |
|
xlim |
|
ylim |
|
rot |
|
fontsize |
|
colormap |
|
table |
|
yerr |
|
xerr |
|
secondary_y |
|
sort_columns |
|
xlabel |
|
ylabel |
|
Parameter |
Type |
Default |
Description |
|---|---|---|---|
|
Series or DataFrame |
None |
The object for which the method is called |
|
label or position |
None |
Only used if data is a DataFrame |
|
label, position or list of label, positions |
None |
Allows plotting of one column versus another. Only used if data is a DataFrame. |
|
str |
|
|
|
tuple |
None |
(width, height) in inches |
|
bool |
True |
Use index as ticks for x axis |
|
str or list |
None |
Title to use for the plot. If a string is passed, print the string at the top of the figure. If a list is passed and subplots is True, print each item in the list above the corresponding subplot. |
|
bool |
None |
(matlab style default) Axis grid lines |
|
bool or 'reverse' |
None |
Place legend on axis subplots |
|
list or dict |
None |
matplotlib line style per column |
|
bool or 'sym' |
False |
Use log scaling or symlog scaling on x axis |
|
bool or 'sym' |
False |
Use log scaling or symlog scaling on y axis |
|
bool or 'sym' |
False |
Use log scaling or symlog scaling on both x and y axes |
|
sequence |
None |
Values to use for the xticks |
|
sequence |
None |
Values to use for the yticks |
|
2-tuple/list |
None |
|
|
2-tuple/list |
None |
|
|
int |
None |
Rotation for ticks (xticks for vertical, yticks for horizontal plots) |
|
int |
None |
Font size for xticks and yticks |
|
str or matplotlib colormap object |
default None |
Colormap to select colors from. If string, load colormap with that name from matplotlib. |
|
bool |
None |
If True, plot colorbar (only relevant for 'scatter' and 'hexbin' plots) |
|
float |
0.5 (center) |
Specify relative alignments for bar plot layout. From 0 (left/bottom-end) to 1 (right/top-end). |
|
bool, Series or DataFrame |
False |
If True, draw a table using the data in the DataFrame and the data will be transposed to meet matplotlib's default layout. If a Series or DataFrame is passed, use passed data to draw a table. |
|
DataFrame, Series, array-like, dict or str |
None |
Equivalent to xerr. |
|
DataFrame, Series, array-like, dict or str |
None |
Equivalent to yerr. |
|
bool |
True |
When using a secondary_y axis, automatically mark the column labels with "(right)" in the legend. |
|
keywords |
None |
Options to pass to matplotlib plotting method. |
5.22.3. SetUp
>>> import pandas as pd
>>> import numpy as np
>>> import matplotlib.pyplot as plt
>>>
>>>
>>> DATA = 'https://python3.info/_static/iris-clean.csv'
>>>
>>> df = pd.read_csv(DATA)
5.22.4. Line Plot
default
>>> plot = df.plot(kind='line')
>>> plt.show()
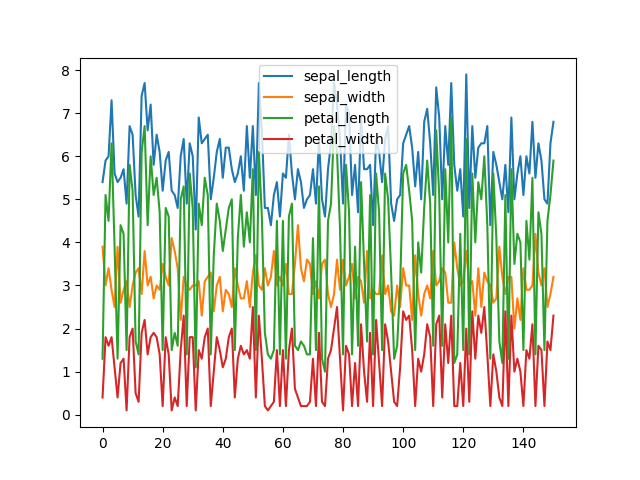
Figure 5.18. Line Plot
>>> plot = df.plot(kind='line', subplots=True)
>>> plt.show()
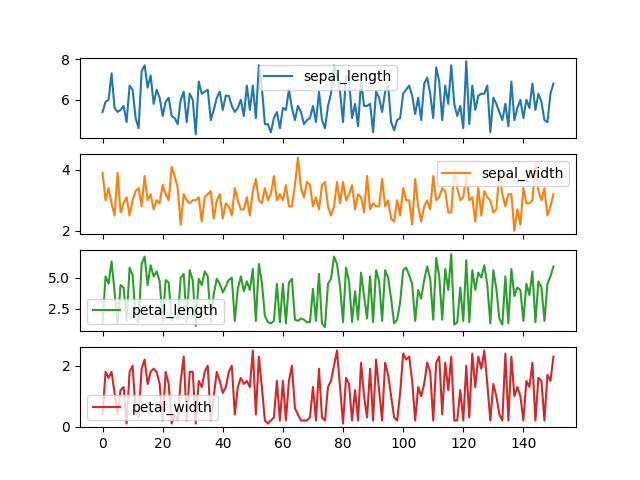
Figure 5.19. Line Plot with Subplots
>>> plot = df.plot(kind='line',
...                subplots=True,
...                layout=(2,2),
...                sharex=True,
...                sharey=True)
>>> plt.show()
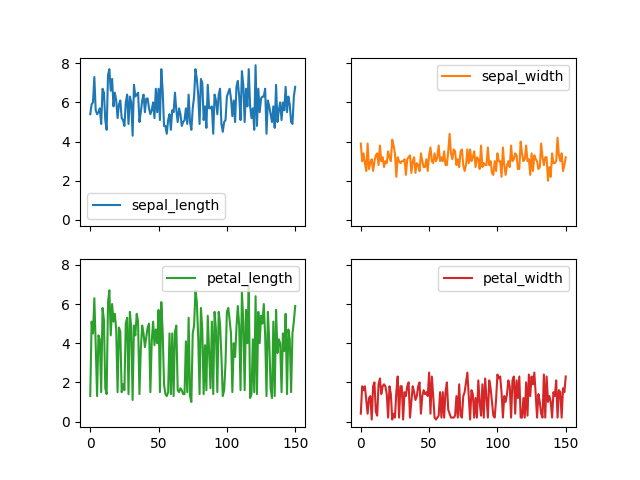
Figure 5.20. Line Plot with Subplots and Layout
5.22.5. Vertical Bar Plot
>>> plot = df.plot(kind='bar', subplots=True, layout=(2,2))
>>> plt.show()
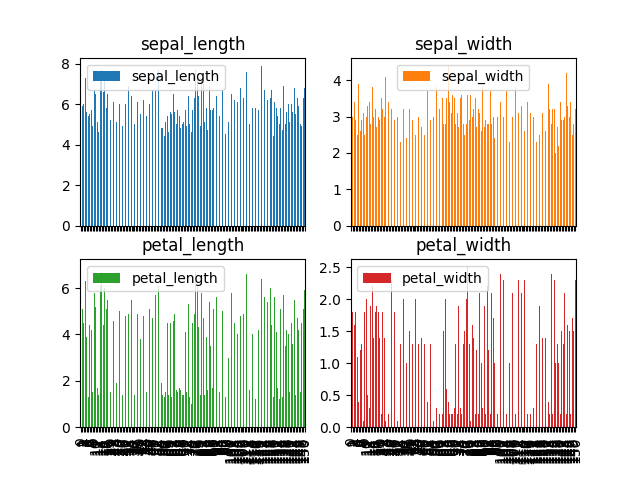
Figure 5.21. Vertical Bar Plot
5.22.6. Horizontal Bar Plot
>>> plot = df.plot(kind='barh',
...                title='Iris',
...                ylabel='centimeters',
...                xlabel='iris',
...                subplots=True,
...                layout=(2,2),
...                sharex=True,
...                sharey=True,
...                legend='upper right',
...                grid=True,
...                figsize=(10,10))
>>> plt.show()
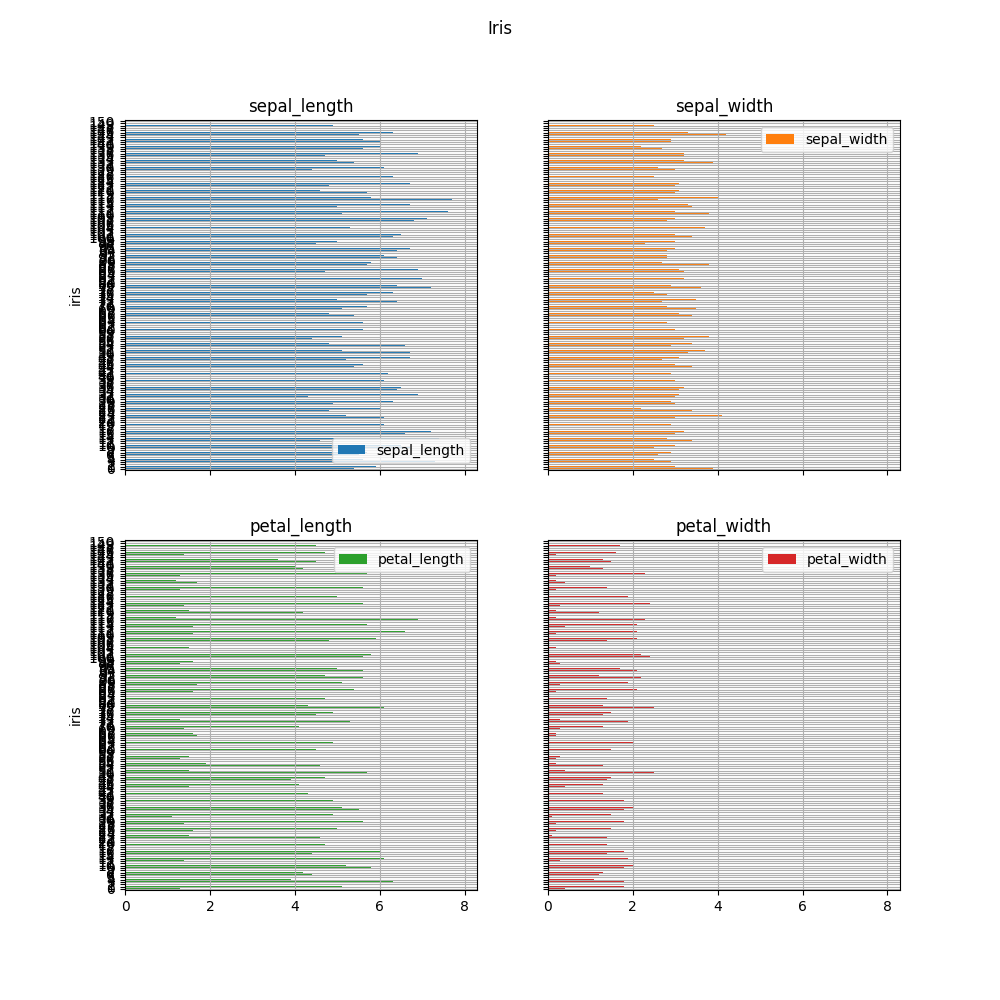
Figure 5.22. Horizontal Bar Plot
5.22.7. Histogram
>>> plot = df.plot(kind='hist',
...                rwidth=0.8,
...                xlabel='centimeters',
...                title='Iris Dimensions Frequency')
>>> plt.show()

Figure 5.23. Histogram
>>> plot = df.plot(kind='hist',
...                rwidth=0.8,
...                xlabel='centimeters',
...                title='Iris Dimensions Frequency',
...                subplots=True,
...                layout=(2,2),
...                sharex=True,
...                sharey=True)
>>> plt.show()
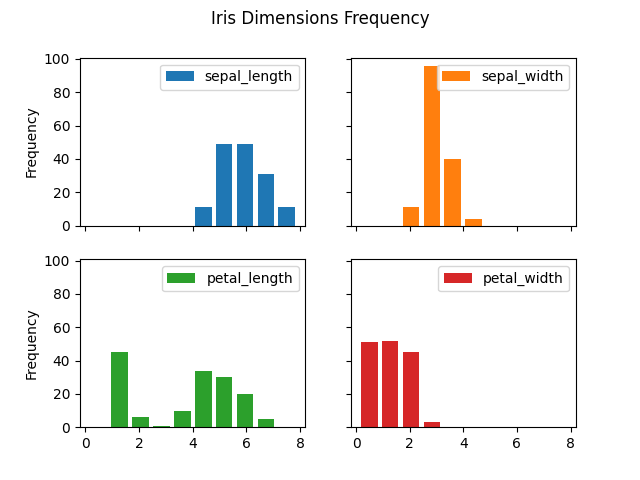
Figure 5.24. Histogram
>>> plot = df.hist()
>>> plt.show()
Figure 5.25. Visualization using hist
>>> plot = df['sepal_length'].hist(bins=3,
...                                rwidth=0.8,
...                                legend=None,
...                                grid=False)
>>>
>>> _ = plot.xaxis.set_ticks(ticks=[4.9, 6.1, 7.3],
...                          labels=['small', 'medium', 'large'])
>>> plt.show()
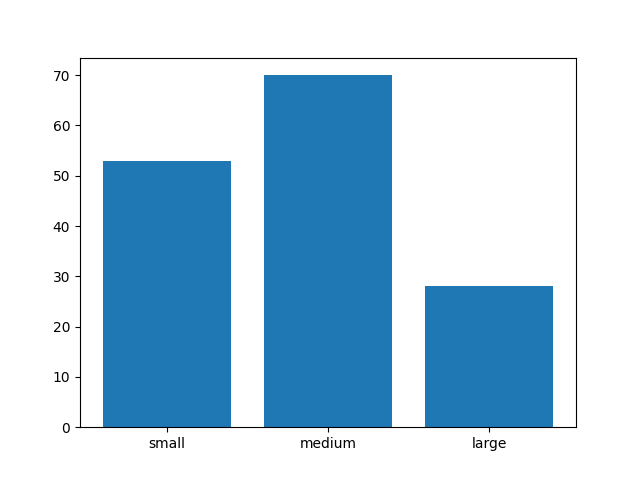
Figure 5.26. Visualization using hist
5.22.8. Boxplot
>>> plot = df.plot(kind='box')
>>> plt.show()
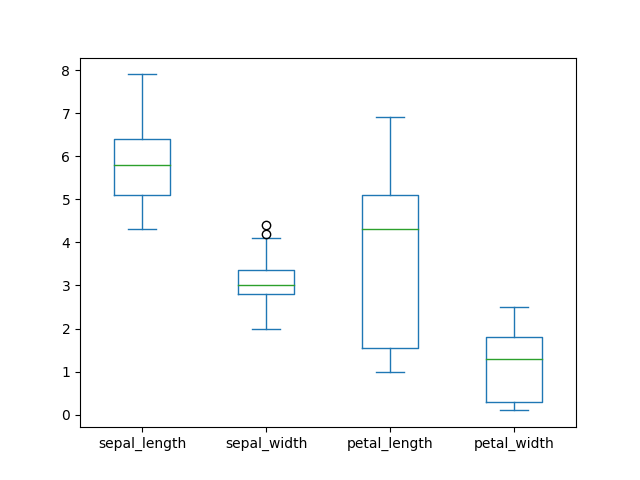
Figure 5.27. Boxplot
>>> plot = df.plot(kind='box',
...                subplots=True,
...                layout=(2,2),
...                sharex=False,
...                sharey=False)
>>>
>>> plt.show()
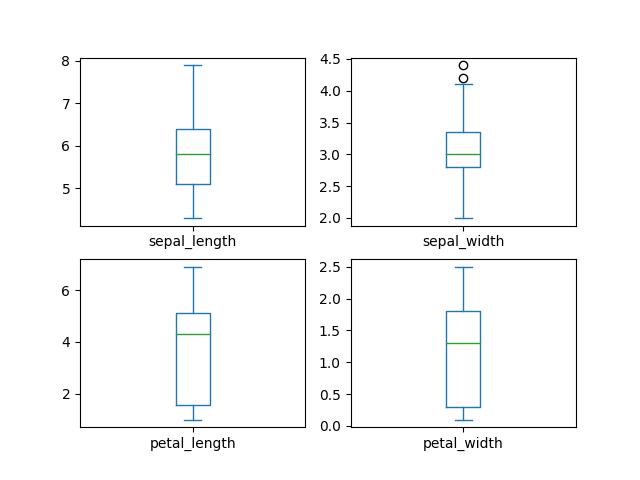
Figure 5.28. Boxplot with layout
5.22.9. Kernel Density Estimation Plot
Also known as
kind='kde'- Kernel Density Estimation
>>> plot = df.plot(kind='density')
>>> plt.show()
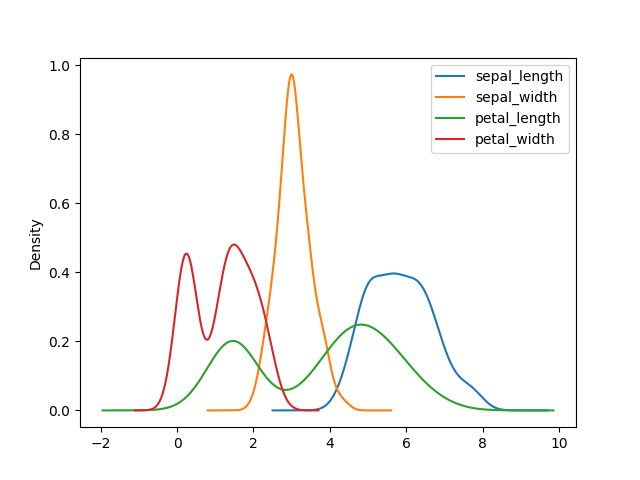
Figure 5.29. Kernel Density Estimation Plot
>>> plot = df.plot(kind='density',
...                subplots=True,
...                layout=(2,2),
...                sharex=False)
>>> plt.subplots_adjust(hspace=0.5, wspace=0.5)  # margins between charts
>>> plt.show()
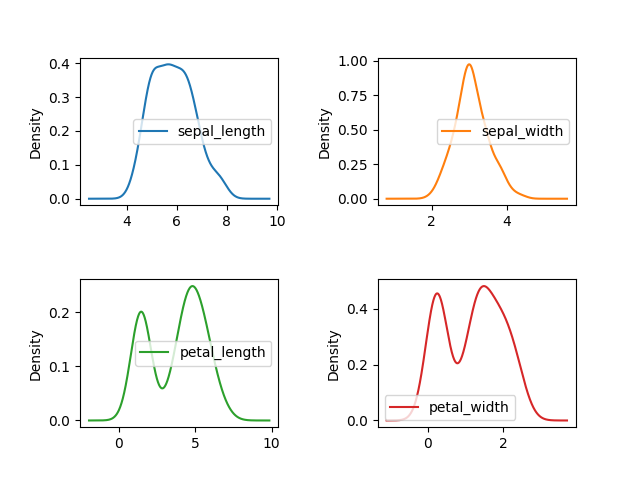
Figure 5.30. Density plot with margins
5.22.10. Area Plot
>>> plot = df.plot(kind='area')
>>> plt.show()
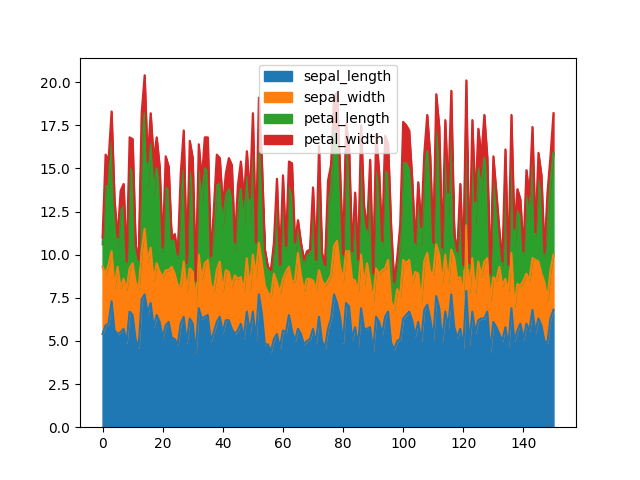
Figure 5.31. Area Plot
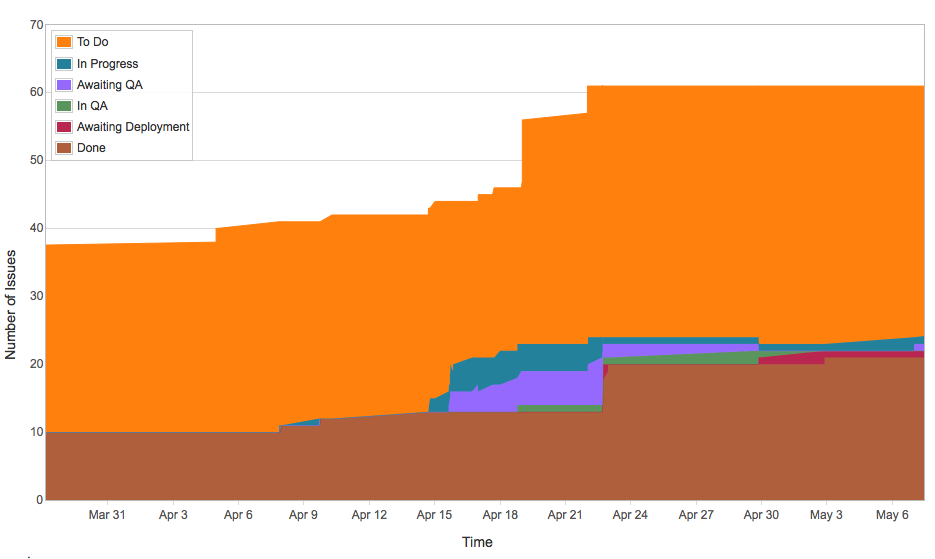
Figure 5.32. Cumulative Flow Diagram in Atlassian Jira
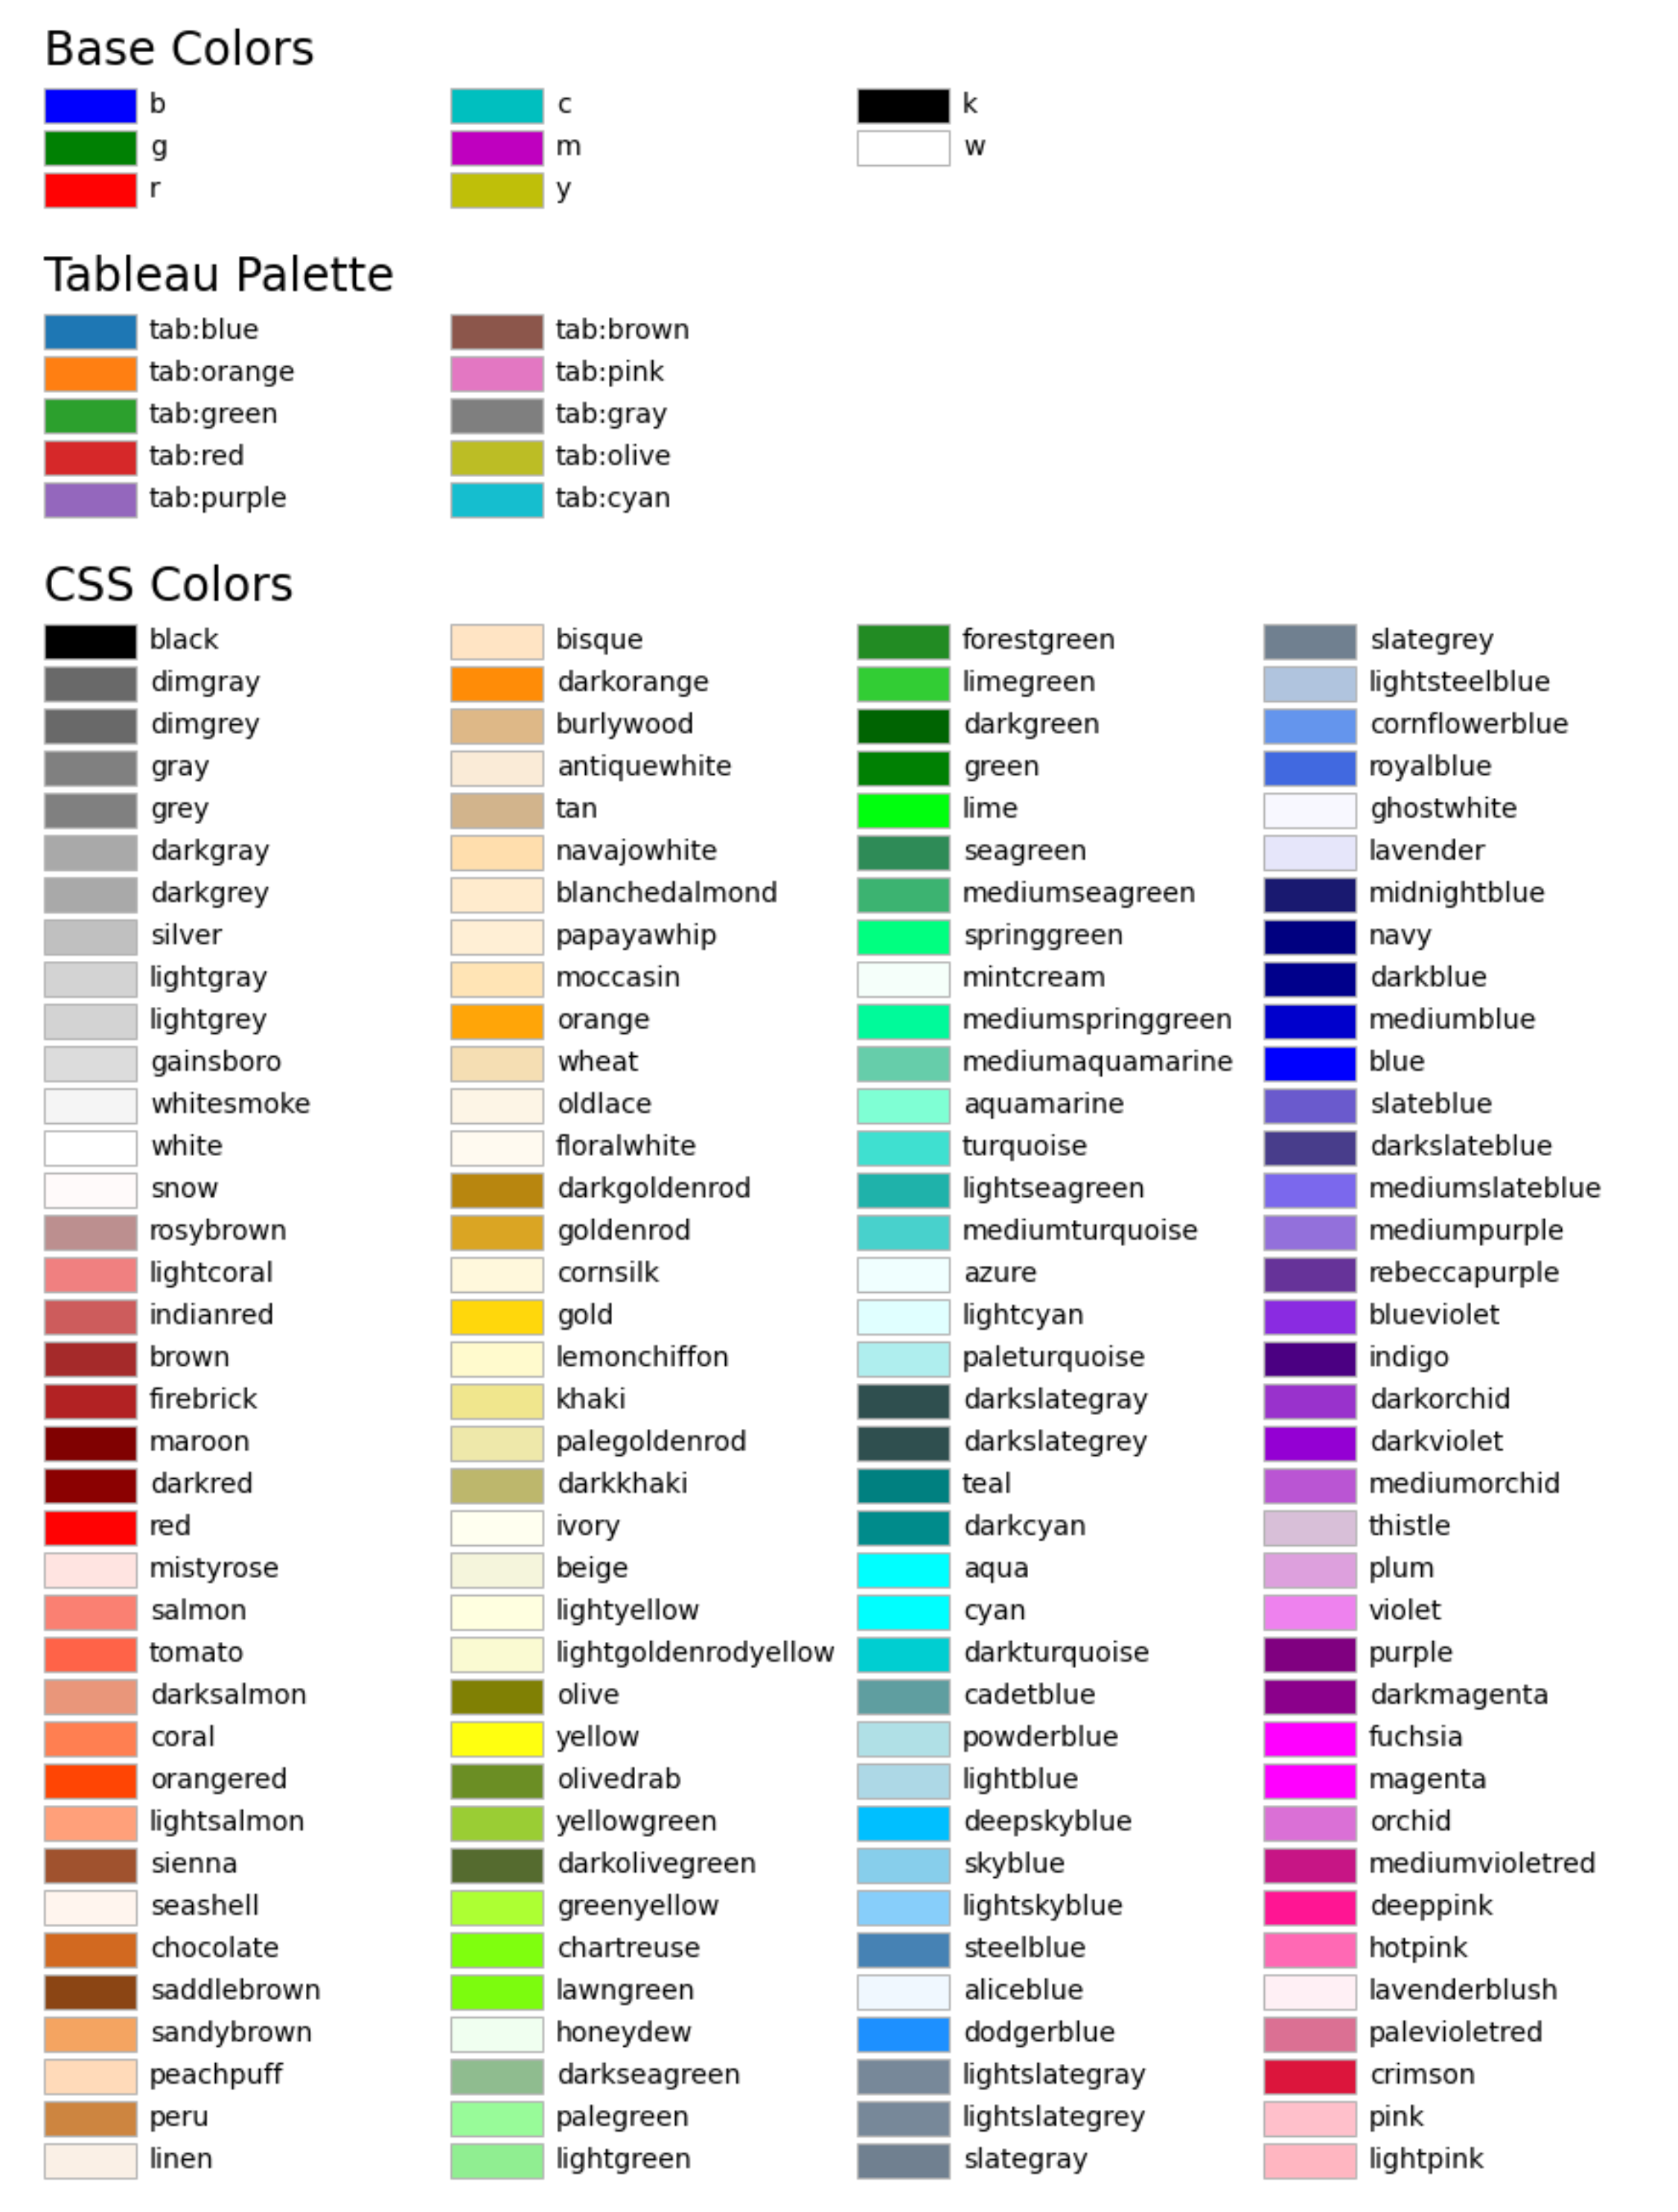
5.22.11. Pie Plot
List of Matplotlib color names [1]
>>> data = pd.cut(df['sepal_length'],
...               bins=[3, 5, 7, np.inf],
...               labels=['small', 'medium', 'large'],
...               include_lowest=True).value_counts()
>>>
>>> plot = data.plot(kind='pie',
...                  autopct='%1.0f%%',
...                  colors=['plum', 'violet', 'magenta'],
...                  explode=[0.1, 0, 0],
...                  shadow=True,
...                  startangle=-215,
...                  xlabel=None,
...                  ylabel=None,
...                  title='sepal_length\nsmall: 0.0 to 3.0\nmedium: 3.0 to 5.0\nlarge: 7.0 to inf',
...                  figsize=(10,10))
>>>
>>> plt.show()
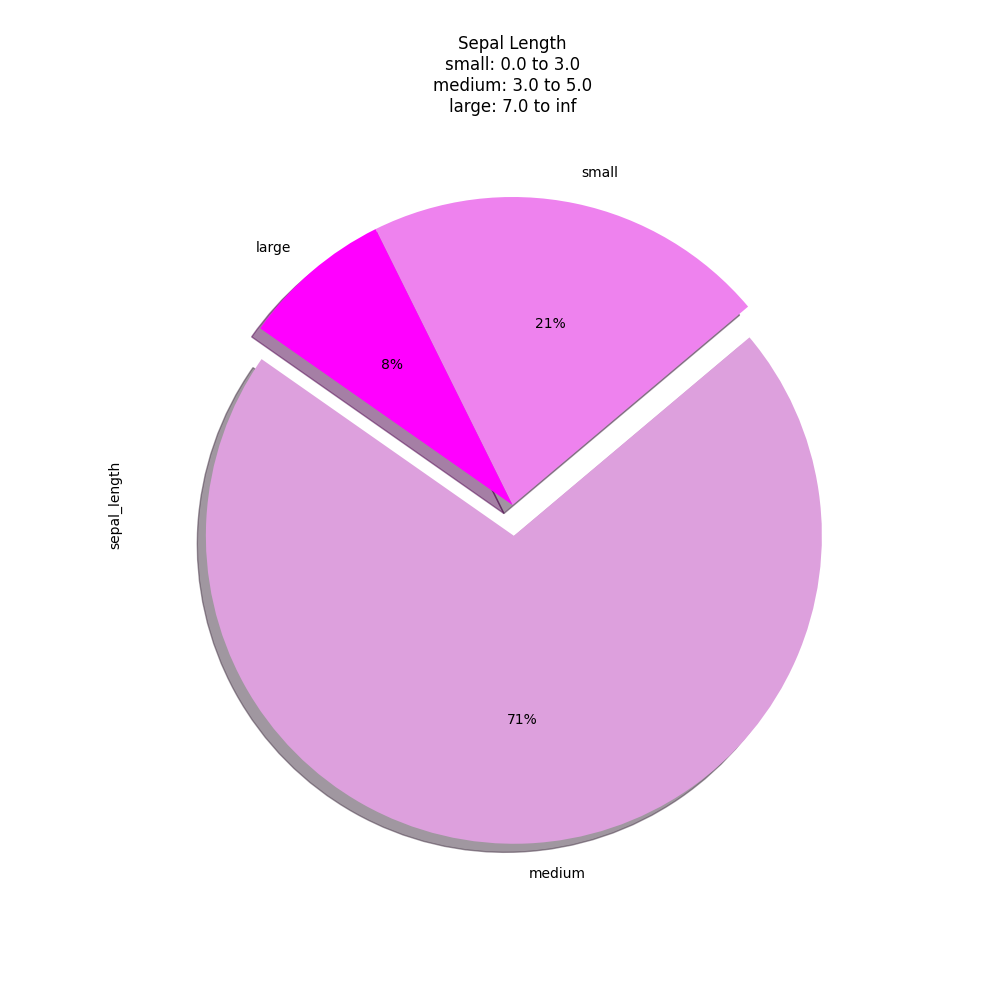
Figure 5.34. Pie Plot
5.22.12. Scatter Plot
>>> plot = df.plot(kind='scatter', x='sepal_length', y='sepal_width')
>>> plt.show()
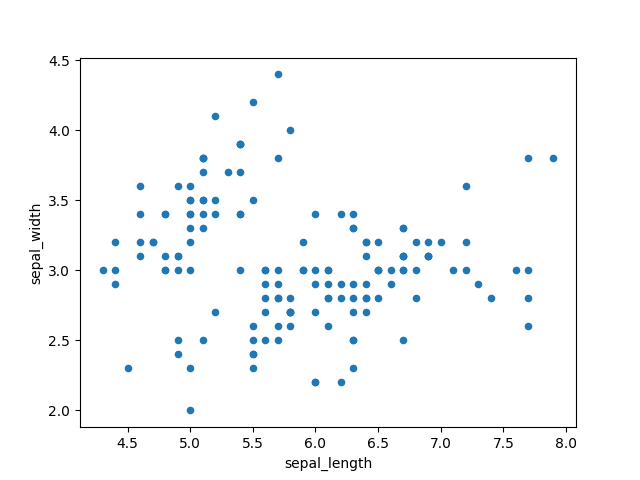
Figure 5.35. Scatter plot: sepal_length vs sepal_width
>>> plot = df.plot(kind='scatter', x='petal_length', y='petal_width')
>>> plt.show()
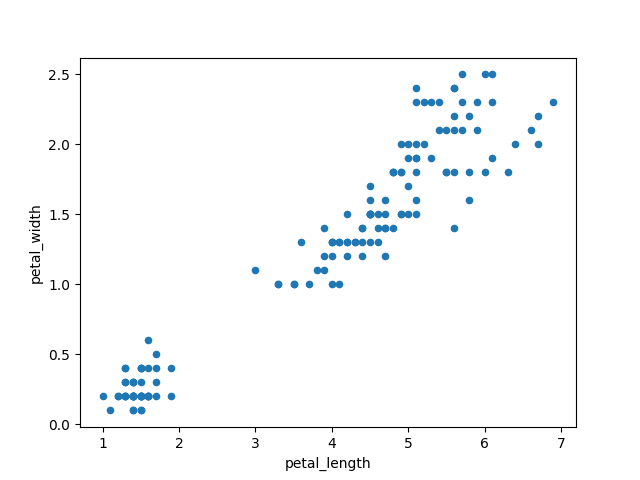
Figure 5.36. Scatter plot: petal_length vs petal_width
>>> data = df.replace({'setosa': 0,
...                    'virginica': 1,
...                    'versicolor': 2})
>>>
>>> plot = data.plot(kind='scatter',
...                  x='sepal_length',
...                  y='sepal_width',
...                  colormap='viridis',
...                  c='species')
>>> plt.show()
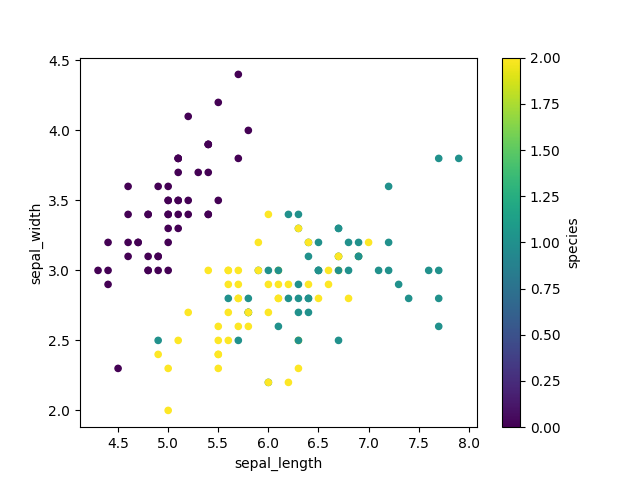
Figure 5.37. Scatter plot using viridis colormap
5.22.13. Hexbin Plot
>>> plot = df.plot(kind='hexbin', x='petal_length', y='petal_width')
>>> plt.show()
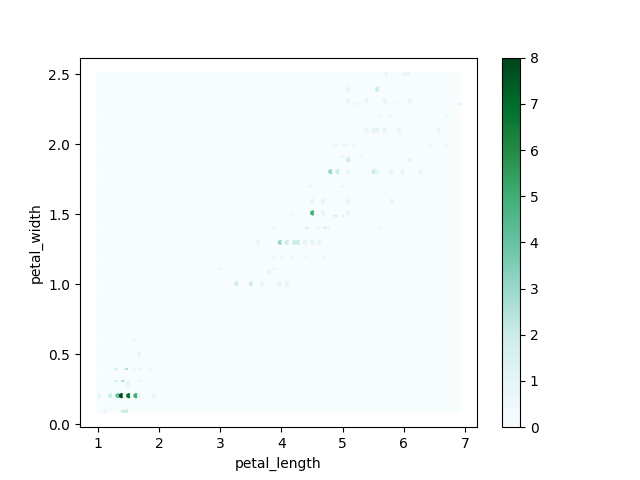
Figure 5.38. Hexbin Plot
5.22.14. Scatter matrix
The in
pandasversion0.22plotting module has been moved frompandas.tools.plottingtopandas.plottingAs of version
0.19, thepandas.plottinglibrary did not exist
>>> from pandas.plotting import scatter_matrix
>>>
>>> plot = scatter_matrix(df)
>>> plt.show()
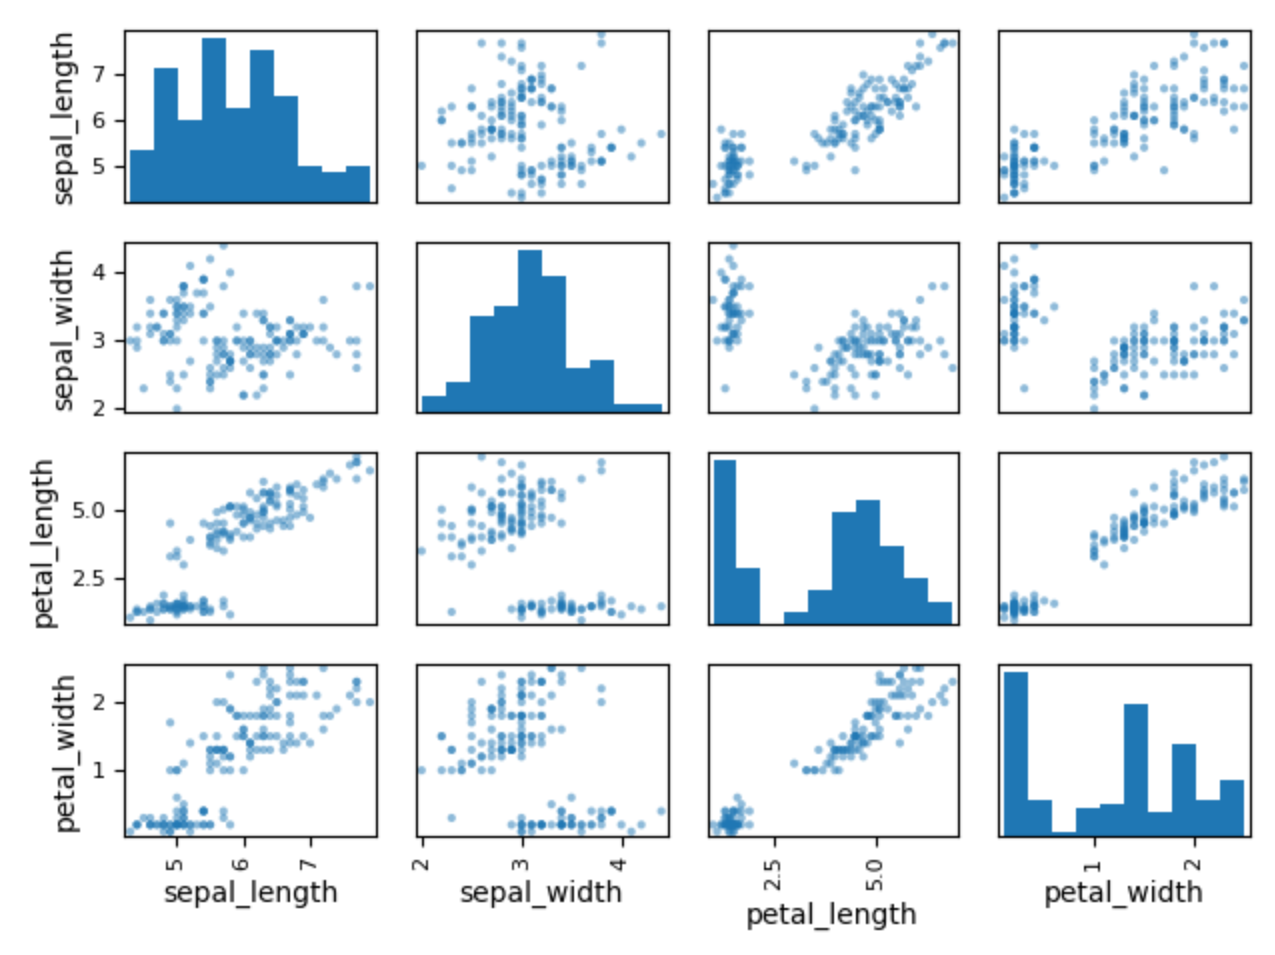
Figure 5.39. Scatter Matrix
>>> data = df[['sepal_length', 'sepal_width', 'petal_length', 'petal_width']]
>>> colors = df['species'].replace({'setosa': 0, 'virginica': 1, 'versicolor': 2})  # colors must be numerical
>>>
>>> plot = scatter_matrix(data, c=colors)
>>> plt.show()
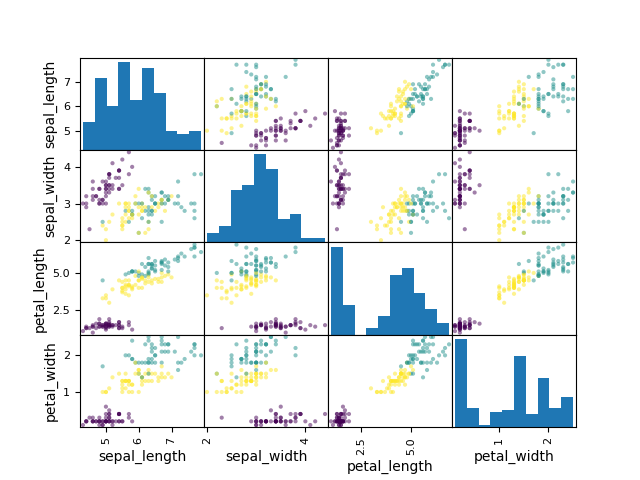
Figure 5.40. Scatter Matrix with colors
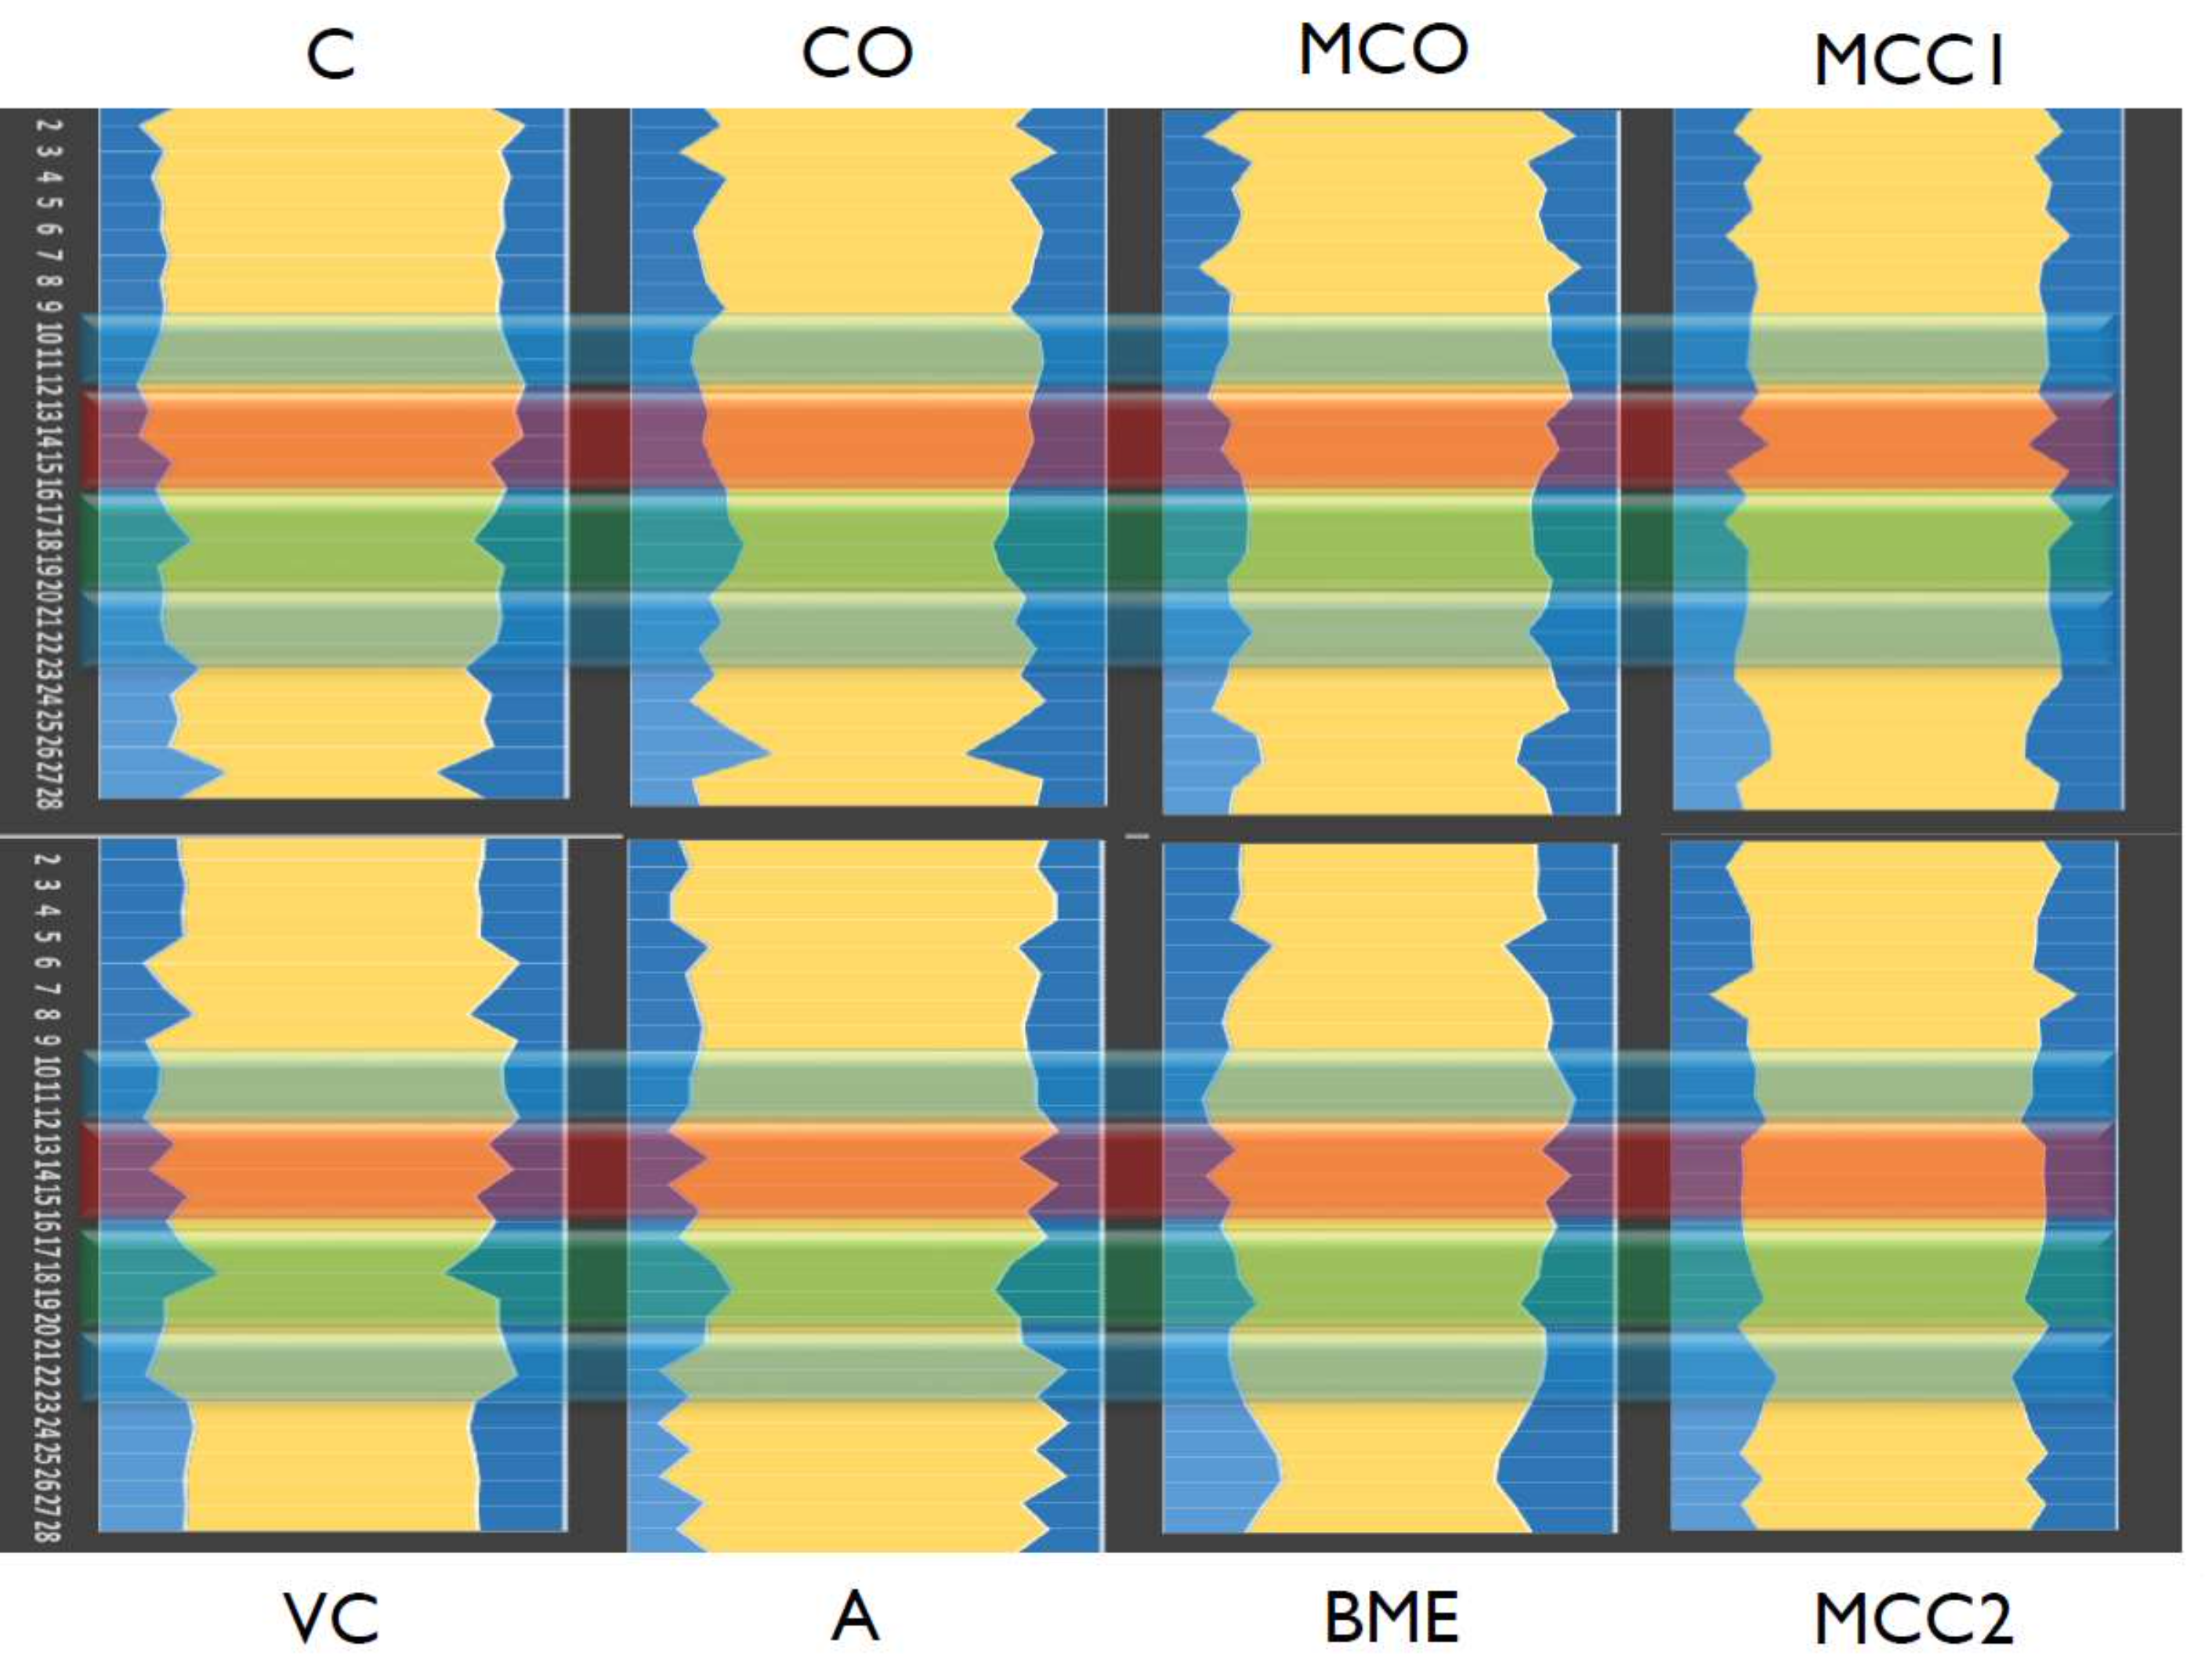
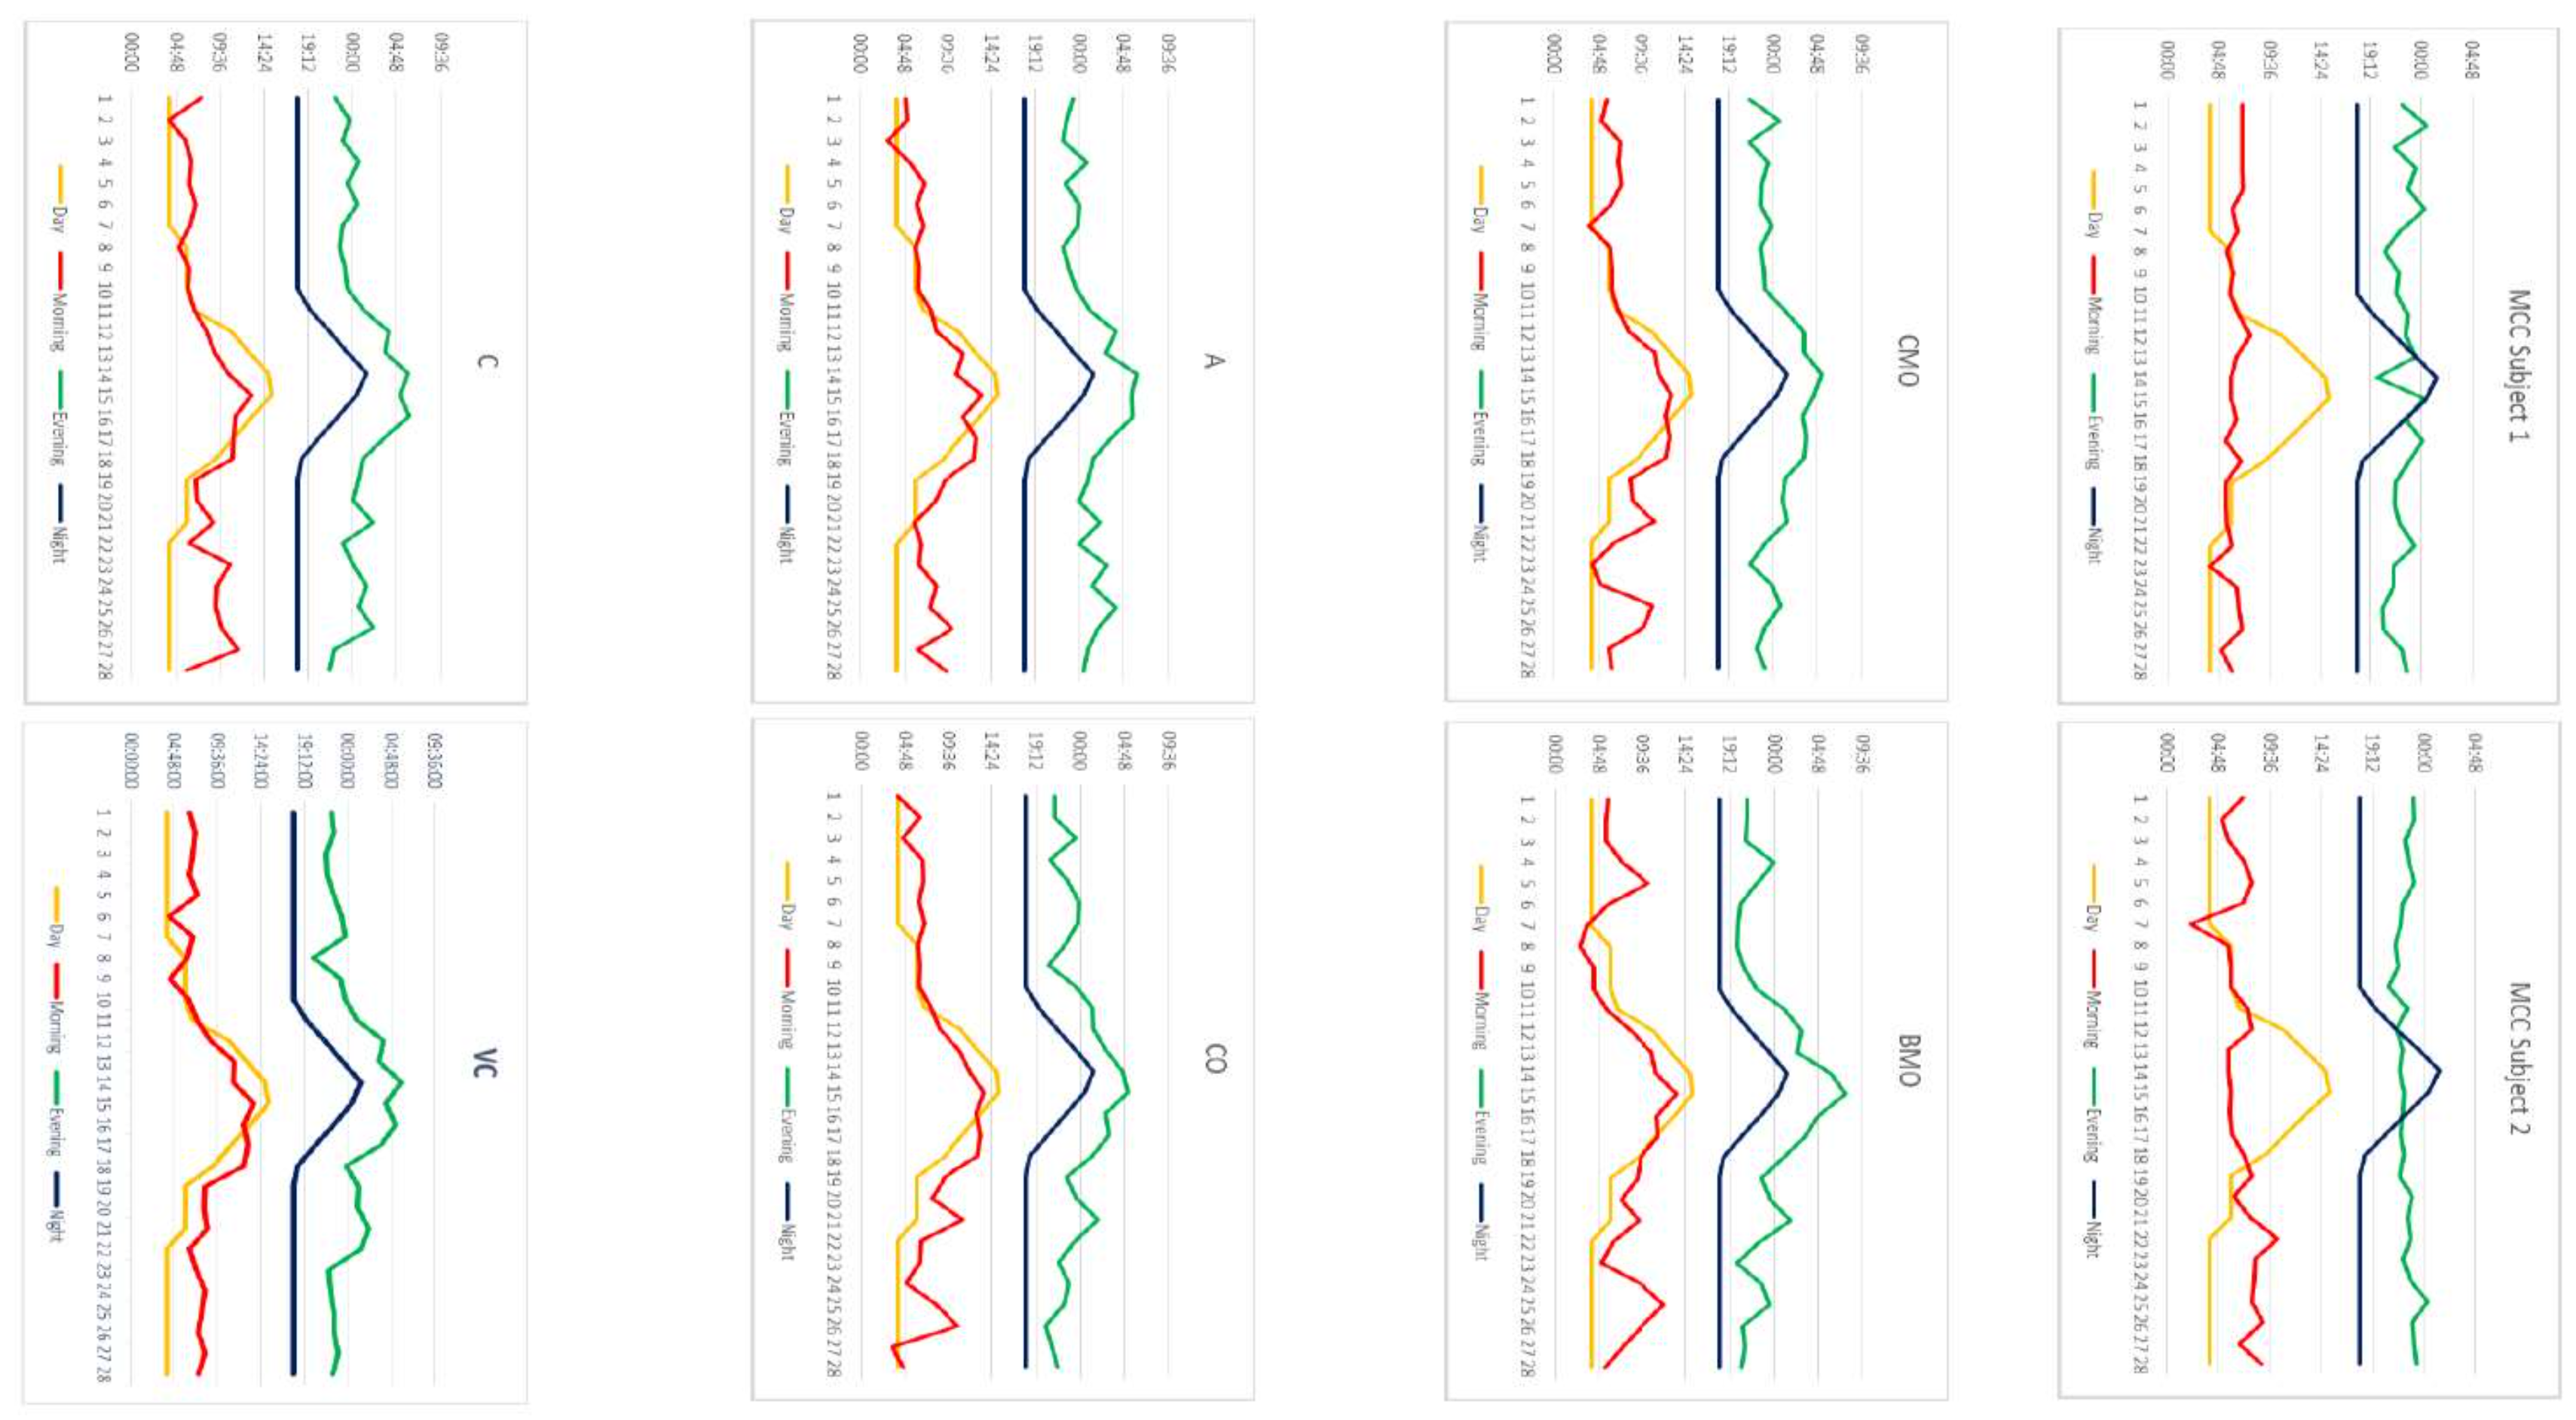
5.22.15. Actinograms
5.22.16. Further Reading
5.22.17. References
5.22.18. Assignments
"""
* Assignment: DataFrame Plot
* Complexity: medium
* Lines of code: 15 lines
* Time: 21 min

English:
    1. Read data from `DATA` as `df: pd.DataFrame`
    2. Select `Luminance` stylesheet
    3. Parse column with dates
    4. Select desired date and location, then resample by hour
    5. Display chart (line) with activity hours in "Sleeping Quarters upper" location
    6. Active is when `Luminance` is not zero
    7. Easy: for day 2019-09-28
    8. Advanced: for each day, as subplots
    9. Run doctests - all must succeed

Polish:
    1. Wczytaj dane z `DATA` jako `df: pd.DataFrame`
    2. Wybierz arkusz `Luminance`
    3. Sparsuj kolumny z datami
    4. Wybierz pożądaną datę i lokację, następnie próbkuj co godzinę
    5. Aktywność jest gdy `Luminance` jest różna od zera
    6. Wyświetl wykres (line) z godzinami aktywności w dla lokacji "Sleeping Quarters upper"
    7. Łatwe: dla dnia 2019-09-28
    8. Zaawansowane: dla wszystkich dni, jako subplot
    9. Uruchom doctesty - wszystkie muszą się powieść

Hints:
    * `pd.Series.apply(np.sign)` :ref:`Numpy signum`
    * `pd.Series.resample('H').sum()`

Tests:
    >>> import sys; sys.tracebacklimit = 0

    >>> pd.set_option('display.width', 500)
    >>> pd.set_option('display.max_columns', 10)
    >>> pd.set_option('display.max_rows', 10)

    >>> assert result is not Ellipsis, \
    'Assign result to variable: `result`'
    >>> assert type(result) is pd.Series, \
    'Variable `result` must be a `pd.Series` type'

    >>> result  # doctest: +NORMALIZE_WHITESPACE
    datetime
    2019-09-28 00:00:00+00:00    1
    2019-09-28 01:00:00+00:00    1
    2019-09-28 02:00:00+00:00    1
    2019-09-28 03:00:00+00:00    1
    2019-09-28 04:00:00+00:00    0
                                ..
    2019-09-28 19:00:00+00:00    1
    2019-09-28 20:00:00+00:00    1
    2019-09-28 21:00:00+00:00    1
    2019-09-28 22:00:00+00:00    1
    2019-09-28 23:00:00+00:00    1
    Freq: H, Name: value, Length: 24, dtype: int64
"""

import numpy as np
import pandas as pd


DATA = 'https://python3.info/_static/sensors-optima.xlsx'
WHERE = 'Sleeping Quarters upper'
WHEN = '2019-09-28'

# type: pd.Series
result = ...